14A1. Purpose of calibrating log. Each
complete log system is calibrated at the factory with a standard U-tube mercury manometer having a scale graduated in knots. The
scale used is derived from the theoretical
values obtained from the following equation:
H=(V2 X C) / 2g
H=height of water
V=velocity
C=a factor determined by the specific
gravity of sea water and the flow
about the dynamic orifice
g=acceleration due to gravity
C is assumed to have a value of 1.02 considering only the specific gravity of sea water;
g has a value of 32.16 feet per second. Since
there has been no consideration of the flow of
water about the rodmeter at factory calibration, it is necessary to calibrate, or adjust, the
log for the particular ship on which it is installed. This calibration is performed during
a trial run over a measured distance, usually
1 mile in length. Trial conditions can rarely
be duplicated; and even with suitable corrections for foul bottom, variations in displacement and trim, and effect of wind and sea,
speed indications derived from an ordinary
cruise are worthless for calibrating the log
system. Similarly, checking distance indications by comparison of the log readings with
the distances traveled between ports cannot
be used for recalibration purposes since the
current effect cannot be determined with the
degree of accuracy required. Thus the most
accurate and suitable method of checking the
calibration of a log under actual operating
conditions is to run the ship over a measured
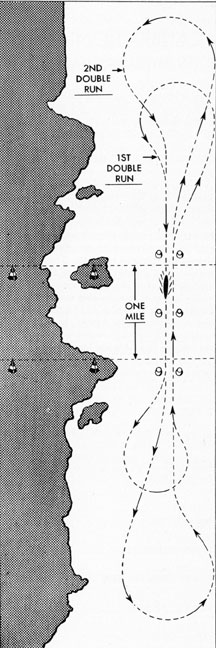
course 1 mile in length (Figure 14-1). Since
the conditions can rarely be duplicated,
record the conditions under which any trial
run is made in a table similar to the following:
U.S.S. .............................
DISPLACEMENT ....................
PROJECTION
OF
RODMETER ...........................
RELATION OF
UNDERWATER
SOUND GEAR
TO RODMETER .........................
DATE .................................
PLACE ................................
LENGTH
OF COURSE ............................
DEPTH
OF WATER .............................
WIND DIRECTION .......................
DIRECTION OF SEA .....................
STATE OF SEA..........................
185
Figure 14-1. Measured mile course.
14A2. Preparations for checking the log.
If the ship is not near a standard measured
mile course, it is possible to use fixed points
1 mile apart as shown in Figure 14-1 If possible, a location should be chosen in which the
current effect is small and which has a direction parallel to the axis of the ship's course.
The depth of water should be, if possible,
greater than 40 fathoms. Shallower water will
prevent the ship from developing proper
speed for a given propeller shaft rpm, and the
log will tend to read high when checked in
shallow water because of wave systems established by the ship and its screws. Before
making the runs over the measured mile, the
log system should be checked for proper
operation as follows:
The hydraulic system should be entirely
free of air. Vent the system as described in
Section 11A5. All hose connections must be
tight. The 3Y circuit of the master transmitter indicator must receive controlled 60-cycle alternating current from the constant
frequency supply. A frequency less than 60
cycles will result in a proportional positive
error in the distance reading. For example,
if the frequency is 59 instead of 60 cycles, the
distance indication will be 1.66 percent low
at all speeds. If the frequency is 61 cycles,
the distance indication will be 1.66 percent
high at all speeds. As the speed is not affected
by the 3Y frequency variations, this distance
error may be detected by timing with a reliable stop watch.
Check the operation of the instruments
before operating on the measured course as
follows: Run the speed indication on the
master transmitter indicator up to 10 knots by
manually moving the main balance arm to the
right. When exactly 10 knots has been indicated, place a slip of clean note paper under
the moving contact to maintain the speed
indicator at 10 knots. At one of the distance
counters, measure the time required to indicate 1 nautical mile. This time should be
6 minutes, plus or minus 3 seconds. If the
time required exceeds the 3-second allowance, follow the method described in Section
13G49 for adjusting an error between the
speed indicator in the master transmitter
186
indicator and the distance indicator of the speed
and distance indicator. A member of the
crew should be stationed at the speed and
distance indicator (repeater) in the conning
tower, and another man, usually the navigator,
stationed where he can observe the entrance
and exit from the measured mile course. Each
man should be equipped with an accurate stop
watch. Make certain that the A1, A2, and B
adjustments are set to the same values as the
factory adjustment values listed for each particular log on the plate mounted in the lower
right-hand corner of the main mounting plate.
14A3. Operation and calculation. The ship
should make two double runs, one at a low
speed (approximately 5 knots), and one at a
high speed (approximately 15 knots). During
a double run, the same shaft rpm should be
maintained throughout. At the exact moment
the ship enters the measured mile course, the
navigator should start his stop watch, and
simultaneously signal to the crew member
stationed at the speed and distance indicator
that the ship has entered the course. At this
instant the man at the speed and distance
indicator will also start his stop watch and
measure the time required for the distance
counter to indicate exactly 1 nautical mile.
The navigator will measure the time required.
to run the exact measured mile. In all probability, the two stop watch readings will not
agree. Therefore, it is necessary that the ship
continue on the same course and maintain the
same propeller shaft rpm until both men complete their timing for each individual mile;
that is, the true mile, and the log-indicated
mile. Repeat the run on the measured mile
course in the opposite direction in the same
manner. Time indications of these runs
should be noted and recorded. Repeat the
double run at the higher speed, and record
the time indications in the same manner as
described at low speed. List the data as follows:
Observed
Calculated
Run No.
Ship's Course
Length of Course Nautical Miles
Time to Travel Measured Mile Min.-Sec.
Time to Travel Indicated Mile Min.-Sec.
True Speed Knots
Log Indicated Speed Knots
Average True Speed
Average Log Indicated Speed Knots
Percent Error
1
311
1
11:30.2
11:03.4
5.22
5.43
5.29
5.49
+3.78
2
131
1
11:10.3
10:49.7
5.37
5.55
3
311
1
4:10.6
3:56.5
14.93
15.23
14.95
15.29
+2.30
4
131
1
4:02.4
3:54.7
14.97
15.35
The following equations are used for calculating the above data:
True speed = (3600 X distance in nautical miles) / (time in seconds to cover measured distance)
Time in seconds = (Minutes X 60) / seconds
Log indicated speed = (3600 X distance measured on counter) / (time in seconds to record log distance)
Average true speed = (Run No. 1 true speed + Run No. 2 true speed) / 2
Average log indicated speed = (Run No. 1 log speed + Run No. 2 log speed) /2
Per cent error = ((Average log indicated speed - Average true speed) X 100 %) / Average true speed
Note: The error is positive when the log speed is greater than the true speed.
The error is negative when the log speed is less than the true speed.
187
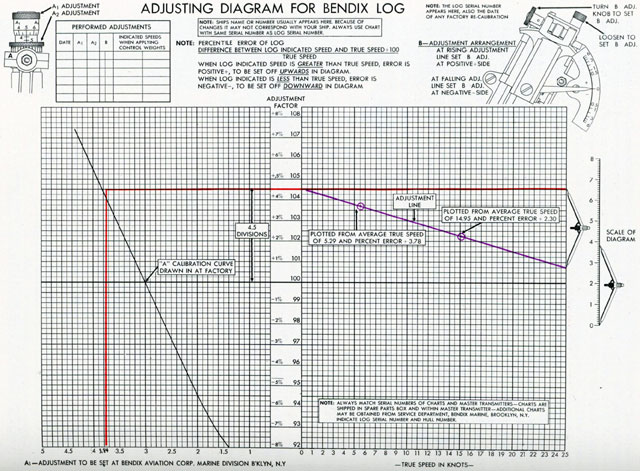
Figure 14-2. Adjusting diagram for calibrating the Bendix log.
188
14A4. General instructions for plotting adjustments. (See Figure 14-2.) Adjustment
diagrams (calibration charts) for each particular Bendix underwater log are furnished
with the log by the Bendix Aviation Corporation, Marine Division, Brooklyn, New York.
The A-calibration line for each particular log
is drawn on the diagram at the factory after
the log mechanism has been tested and adjusted at the factory. Note the curved black
line in Figure 14-2. Charts are shipped in the
spare parts box, and within the master transmitter indicator. Additional charts may be
obtained from the service department of the
manufacturer. When ordering, always indicate the log's serial number and the hull
number.
14A5. Plotting true speed in knots adjustment line. (See Figure 14-2.) Using the
figures for the average true speed of the first
double run (in this case 5.29), and the percent
of error of the first double run (in this
case +3.78), locate these points on the graph
as shown in Figure 14-2. The figures in the
vertical column in the center of the chart
represent percent error in this manner: Each
full division, that is, the distance between
figures, represents 1 percent. Divisions above
the 100 line represent positive error and divisions below the 100 line represent negative
error. Figures in the horizontal line at the
lower right side of the chart represent the
true speed in knots. Plot the point on the
graph for the high-speed double run as shown
in Figure 14-2. Draw a line through these two
plotted points on the graph as shown by the
solid blue line in Figure 14-2.
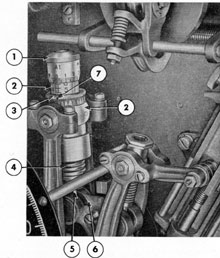
14A6. Obtaining value for A1-adjustment.
(See Figures 14-2 and 14-3.) Draw a horizontal line through the point where the adjustment line intersects the zero knot line
from the A-calibration curve to the 25-knot
line on the chart as shown by the solid red
horizontal line in Figure 14-2. Draw a vertical
line from the point of intersection of the
horizontal line just drawn, and the A-calibration curve, downward to the base line as
shown by the solid red vertical line in Figure
14-2. Read and record the figure at the point
at which this vertical line intersects the base
1. A1 ADJUSTMENT KNOB
2. AXLE
3. A2 ADJUSTMENT RING
4. A SPRING (MAIN SPRING)
5. CONNECTOR SCREW
6. MAIN BALANCE ARM
7. RED DOT Figure 14-3. The A-adjustment assembly.
line (in this case 3.84) as shown in Figure
14-2. This is the value at which the A1-adjustment knob must be set. Turn the A1-adjustment knob to this value and note the direction
in which the knob was turned.
14A7. Obtaining value for A2-adjustment.
(See Figures 14-2 and 14-3.) Count vertically
the number of major divisions at the zero knot
line from the 100 line to the adjustment line.
In this case it is 4 1/2 divisions as shown in
Figure 14-2. This is the value at which the
A2-adjustment must be set. Turn the A2-adjustment ring the number of divisions
counted, in the same direction that the A1-adjustment knob was previously turned. We
now have completed setting of the A1- and A2-adjustments. Observe the reference line
shown on the axle in Figure 14-3. During
factory calibration, a red dot is put above this
189
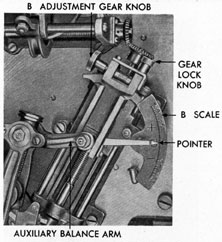
Figure 14-4. The B-adjustment assembly.
reference line on the A2-adjustment ring to
indicate the zero setting of the A2-adjustment. Shipboard adjustments are made thereafter from this reference mark.
14A8. Obtaining value for B-adjustment.
(See Figures 14-2 and 14-4.) Using dividers
at the 25-knot line, measure the distance along
this line which separates the adjustment line
from the previously drawn horizontal line as
shown in Figure 14-2. Transpose this distance
by means of the dividers to the scale of diagram at the right side of the chart. This reading from the scale of diagram is the numerical
value at which the B-adjustment must be set
(in this case 3.85). If the adjustment line
slopes downward to the right (as shown in
the diagram), the B-adjustment is to be set
on the negative side of the B-adjustment
scale on the instrument. Conversely, if the
adjustment line slopes upward to the right,
1. A1 ADJUSTMENT KNOB
2. A2 ADJUSTMENT RING
3. B ADJUSTMENT GEAR KNOB
4. GEAR LOCK KNOB
5. B SCALE
6. WEIGHT ARM
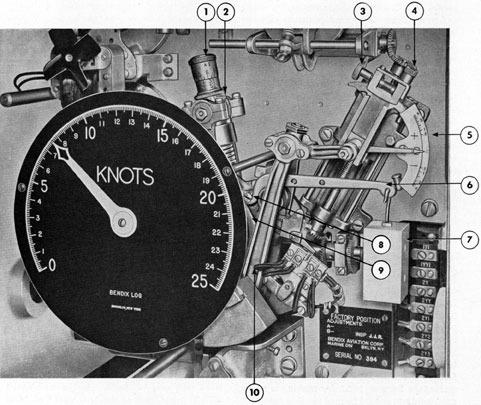
7. INDEX SCREW
8. MAIN BALANCE ARM
9. AUXILIARY BALANCE ARM
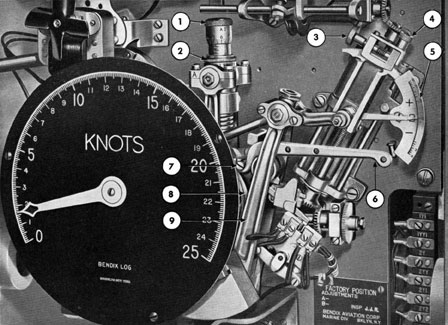
Figure 14-5. Weight arm attached to instrument.
190
1. A1 ADJUSTMENT KNOB
2. A2 ADJUSTMENT RING
3. B ADJUSTMENT GEAR KNOB
4. GEAR LOCK KNOB
5. B SCALE
6. WEIGHT ARM
7. WEIGHT
8. INDEX SCREW
9. MAIN BALANCE ARM
10. AUXILIARY BALANCE ARM
Figure 14-6. Weight arm attached to instrument.
the B-adjustment is to be set on the positive
side of the B-adjustment scale in the instrument. Set the B-adjustment from the
value determined above as follows: Loosen
the gear lock knob. Turn the B-adjustment
gear knob until the pointer is at the 3.85
position on the negative side of the B-scale.
Tighten the gear lock knob.
14A9. Recording the A1-, A2-, and B-adjustments. After setting the A1-, A2-, and
B-adjustments to the values obtained in
Sections 14A6, 14A7, and 14A8, record the
values obtained in the performed adjustments
table in the upper left-hand corner of the adjustment diagram as shown in Figure 14-2.
14A10. Checking A1-, A2-, and B-adjustments with weight and arm. (See Figures 14-5
and 14-6.) After setting and recording the
A1-, A2-, and B-adjustments as described in
Section 14A9, check the recorded adjustment
191
values as follows: Set the maneuvering cocks
and vent cocks to the zero position. Set the
instrument to zero position by means of the C-adjustment as described in Section 13A4.
Hang the weight arm only on the index
screw of the main balance arm as shown in
Figure 14-5. Note the speed indication obtained, and record it at the upper left-hand
corner of the adjustment diagram. Repeat
the operation using the weight arm and
weight together, as shown in Figure 14-6.
When the log is checked at some future time
to see if the adjustments have changed due
to temperature, spring tension or for some
other reason, use the following procedure:
Hang the weight arm alone, and then the
weight arm and the weight together on the
index screw as previously described. Compare
the speed values obtained with the
recorded values in the performed adjustments table. If the values are the same within
1/10 knot, the adjustments have not been
changed. If the values have changed, check
the instrument carefully. See that the contacts are clean, that all connections and screws
are tight, that the adjustments have not been
changed, and that the instrument generally
is in good condition. If the above checks
indicate that the instrument is in a satisfactory condition, it will be necessary to
make a recalibration run at the earliest possible opportunity, unless the navigator is
satisfied with the speed and distance indications obtained. See Section 1413 for information on recalibration.
B. RECALIBRATION OF THE MASTER TRANSMITTER INDICATOR
14B1. Purpose. The purpose of the recalibration run is to correct the log when
it is in error. The log may be in error due
to one or more of the following reasons: The
condition of the hull has been radically
changed; the previous run was not properly
made, or the instrument and/or rodmeter
has been changed in some way.
14B2. Preparation. The preparations described in Section 14A2 for making a measured mile run should be made in this case with
the important exception that the A1-, A2-, and
B-adjustments are to be set at the same values
as last recorded in the performed adjustments
table at the upper left-hand corner of the adjustment diagram (Figure 14-7).
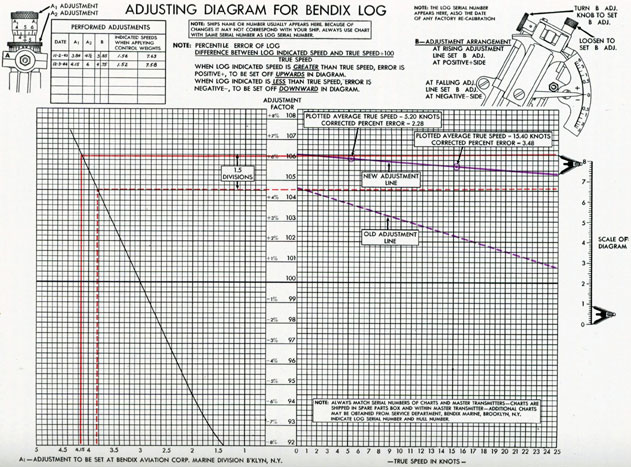
14B3. Operation and calculation. (See Figure 14-7). Make the trial runs and calculations as described for the measured mile runs
in Section 14A3. Make one additional set of
calculations as follows: On the adjustment
diagram there appears an adjustment line
for the previous trial run. This dotted blue
line on the sample diagram (Figure 14-7), is
the line from which all plotting and calculations will now be made. At the true speed
of 5.20 knots, and at the true speed of 15.40
knots, adjustment factors of 103.8 and 102.25
respectively are obtained. This will then
give values which are to be recorded in the
following additional table:
14B4. Plotting the new adjustment line.
(See Figure 14-7.) Plot the new adjustment
line as follows: Add algebraically, the corrected percent errors to the adjustment
factors at the true speeds obtained, and plot
on the diagram as before (see Figure 14-7).
In this example, the corrected percent error
of 2.28 added to the adjustment factor of
103.8 equals 106.08, and the corrected percent
error of 3.48 added to the adjustment factor
of 102.25 equals 105.73. Draw the new adjustment line through the plotted points obtained
as shown by the solid blue line in Figure 14-7.
14B5. Obtaining A1-value. (See Figure 14-7.) Obtain the new A1-adjustment value by
drawing a straight line horizontally across
the diagram through the point at which the
new adjustment line intersects the zero knot
line, and extending it to the A-calibration
curve as shown by the solid red horizontal
line. Draw a vertical line (solid red) downward from the point at which the previously
drawn solid red horizontal line intersects the
A curve, to the base line. The reading at this
base line point is the value at which the A1-adjustment is to be set (in this case, 4.15).
14B6. Obtaining A2-value. (See Figure 147.) Obtain the A2-adjustment value by counting the .number of divisions between the
points at which the old and new adjustment
lines intersect the zero knot line on the diagram; in this case 1.5 divisions. That is, the
A2-adjustment is to be turned 1.5 divisions
from the previous setting in the same direction in which the A1-adjustment knob was
turned.
14B7. Obtaining B-value. (See Figure 147.) Obtain the value at which the B-adjustment is to be set in the following manner:
Using dividers, measure the distance between
the intersection of the solid red horizontal
line with the 25-knot line, and the intersection of the new adjustment line (solid blue)
with the 25-knot line. Transpose this distance to the scale of diagram. This gives the
percentage (value) that the B-adjustment is
to be set away from the previous setting. In
this case the B setting is minus 0.9. Therefore, the B-adjustment is to be set at minus
4.75.
14B8. Setting and recording new adjustments. Set the A1-adjustment knob to
the value 4.15 obtained in Section 14135. Set
the A2-adjustment away from the previously
recorded setting by the value 1.5 divisions
as determined in Section 14B6. Be sure to
turn the A2-adjustment ring in the same
direction that the A1-adjustment knob was
turned. Set the B-adjustment away from the
previously recorded adjustment value by the
amount of the value obtained, in this case
minus 4.75, as determined in Section 14B7.
Record the new adjustment values in the
table at the upper left-hand corner of the
adjustment diagram as shown in Figure 14-7.
Hang the weight arm, and then the weight
arm and the weight on the index screw of
the main balance arm as shown in Figures
14-5 and 14-6. Record these speed indications
in the performed adjustments table in the
upper left-hand corner of the adjustment
diagram as shown in Figure 14-7.
C. CALIBRATION OF THE LOG WHEN PERCENTAGE ERROR
EXCEEDS 8 PERCENT
14C1. Purpose. This method of calibration
is to be used only when the log error, determined during trial runs, exceeds plus or
minus 8 percent.
14C2. Preparation. Trial runs have been
made, and the percent error at certain true
speeds determined. Carefully check all the
data and calculations before proceeding with
this method of calibration.
14C3. Operation and calculation for setting
B-adjustment. Set the maneuvering cocks
and drain cocks to the zero position. Attach
the weight arm, provided in the spare parts
box, to the index screw on the main balance
arm, as shown in Figure 14-5. Make and
hang weights, preferably lead, on the arm so
that the speed indications can be run up to
the log indicated speeds obtained in the
193
Figure 14-7. Adjusting diagram for recalibrating the Bendix log.
194
calculations for the trial runs. Mark each
weight for ready identification. Subtract the
percent error at a true speed of approximately 5 knots from the percent error at a
true speed of approximately 15 knots, and
divide this value by 0.4. Then set the B-adjustment to this value on the plus side
of the B-scale; if the percent error at 15
knots is greater than the percent error at 5
knots, in a positive direction. Set the B-adjustment on the negative side of the scale
is high at 15 knots, turn the B-adjustment
toward a positive, or more positive, reading
on the B-scale and try adjusting again.
NOTE: When 5 and 15 knots are mentioned in the above text, they are used merely
to indicate the low and high speed runs at
which the trial runs were made.
14C5. Calibration when percent error exceeds 8 percent. The following is an example
of calibration when the percent error is
greater than 3 percent:
Average True Speed Knots
Average Log Indicated Speed Knots
Percent Error
5.20
4.65
-10.5%
15.12
13.87
- 8.3%
if the percent error at 15 knots is less than
the percent error at 5 knots in a negative
direction.
14C4. Operation and calculation for setting
A1- and A2-adjustments. Hang a weight for
a log indicated speed equivalent to a true
speed of approximately 5 knots on the weight
arm, and use the A2-adjustment ring to bring
the pointer to the true speed at approximately
5 knots. Hang the weight equivalent to a true
speed of approximately 15 knots on the same
weight arm. Bring the pointer to a true
speed of approximately 15 knots by adjusting the A1-adjustment knob. Repeat these
operations using 5- and 15-knot weights in
conjunction with the A2- and A1-adjustments
until the reading of a low true speed, plus
or minus 1/10 (0.10) knot, and a high true
speed of plus or minus 15/100 (0.15) knots is
obtained. If it seems to be impossible to
obtain the proper readings at 5 and 15 knots,
that is, if a reading is correct at 5 knots, and
is low at 15 knots and cannot be changed,
turn the B-adjustment toward a negative, or
more negative reading on the B-scale, and
try adjusting again. If it seems impossible to
obtain the proper readings at 5 and 15 knots,
that is, if a reading is correct at 5 knots and
Weights are made that will make the log
indicate 4.65 and 13.87 knots. The weights
are marked for ready identification. Subtract
the percent error at 5.20 knots from the percent error at 15.12 knots; that is (-8.3) minus
(-10.5) equals plus 2.2. Divide 2.2 by 0.4
which equals plus 5.5 percent. The B adjustment is then set at plus 5.5 percent. Add
a weight to make the pointer indicate 4.65
knots. The pointer will not indicate exactly
4.65 knots, as before, because the B setting
has been changed. By means of the A2-adjustment ring, the instrument is made to
indicate 5.20 knots. In this case the A2-ring
is backed off. Then hang a weight required
to make the log indicate 13.87 knots to the
weight arm. Again the log will not, indicate
exactly 13.87 knots because the B- and A2-adjustments have been changed. The log is
made to indicate exactly 15.12 knots by turning the A1-adjustment. In this case the A1-adjustment is turned out (counterclockwise
when looking downward on the knob), because the original percent error was low
(negative). After the A1-adjustment has
been made, remove the heavy weight and
apply the weight required for the low speed
reading. The reading probably will be high
195
because of the previous change in the A1-setting. Therefore, the A2-ring must be
turned downward (clockwise when looking
downward on the ring) until a reading of
exactly 5.20 knots is obtained. The reading
is probably low, so again the A1-adjustment
must be turned out. If the range of the A1-adjustment is exceeded, the plug on the bottom
of the A-spring assembly must be turned
as follows: Turn the plug a small part of
a rotation (10 or 15 degrees). Turn the plug
outward if the A1-adjustment has been turned
all the way out. Conversely, turn the plug
inward if the A1-adjustment has been turned
all the way in.