So far this textbook has dealt primarily with
the behavior of sound in sea water, the ocean
climate and characteristics, and marine life, all of
which affect the transmission and reception of
sound. Listening systems were described briefly
at the end of chapter 3. The present chapter
gives particular attention to echo-ranging systems
and problems associated with echo ranging.
The typical echo-ranging system to be discussed
here is of the directional-beam (searchlight) type.
Particular emphasis is given to transducers because of their importance in the development of
sonar. The purpose of this chapter is to give the
reader a broad understanding of the basic components needed in an echo-ranging system.
TRANSMITTER
The source of the signal is called the transmitter
and can be compared directly with the transmitter
of a radio station. There is a variable-frequency
oscillator that generates a signal in the frequency
range of from 17 to 27 kc. This signal is fed into
a wide-band amplifier that increases the signal intensity to about 400 watts if a magnetostriction
transducer is to be driven, and to about 150 watts
if a crystal transducer is to be driven. This signal
is then used to drive the transducer. The length
of transmission is controlled by keying contacts
on the timing device. The measurement of time
is started at the same time as the transmission.
The timing device closes the keying relay at zero
indication on the range scale. This action connects the transducer to the output of the transmitter and at the same time keys the oscillator
for a predetermined length of time. When this
time is over the relay returns the transducer to
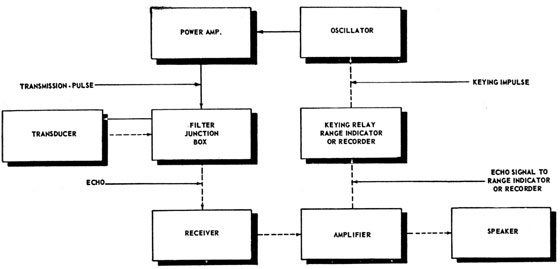
the receiver, so that any echo may be heard. The
signal in the echo-ranging equipment may be followed
in figure 4-1, which is a block diagram of
the signal circuits.
SIGNAL USED IN ECHO RANGING
Signal Frequency
Practical considerations set rather definite upper
and lower limits to the frequencies that can be
used in echo ranging. The use of sonic frequencies
(less than 10 kc) has not been considered practicable because of directivity requirements. A
second reason for the use of ultrasonic sound is
provided by considerations of the detectability of
echoes. Echoes must always be detected against
a background of interfering noises. Although
these noises include sound of ultrasonic frequencies,
the greater part of their energy is in the sonic
region. Hence, ultrasonic echoes are masked less
than sonic ones.
An upper limit to the practicable frequency is
set by the attenuation of the sound in the sea.
The attenuation coefficient increases very markedly with frequency. Hence, for search purposes,
where long ranges are required, a frequency higher
than about 25 to 30 kc is not suitable. When the
range is being closed, and great accuracy of bearing is needed rather than a long range, the greater
directivity associated with higher frequencies is
the determining factor, and thus frequencies of
from 50 to 100 kc may be useful. These frequencies ate especially useful for depth determination, where an extremely narrow beam is required; and because accurate depth determination
is practicable only at comparatively short ranges,
the high attenuation consequent to using high
frequencies is not significant.
The United States Navy at first adopted a compromise value of 24 kc. This frequency allowed
fair directivity to be achieved while the size of
76
the transducer could be kept within practical
limits. The attenuation was moderate. equipment using only 24-kc frequency is now being
replaced by more elaborate equipment that can
emit various frequencies, for the reasons just
mentioned.
Figure 4-1 -Block diagram of an echo-ranging equipment.
Receiver-Amplifier
When the signal has been emitted, the transducer connections in the filter junction box are
changed so that the transducer can act as a receiver of sound waves. An echo from a target or
other sounds of proper frequency incident on the
transducer plate produce oscillations that represent the various signals, but the frequency of these
sounds is too great to be perceptible to the human
ear. The mechanical pressure of the sound waves
is converted into alternating currents by the magnetostrictive or piezoelectric effect. These signals
must be amplified and changed to frequencies in
the audible range, or they may be portrayed so
as to be interpreted by the eye. The purpose of
the receiver is to amplify the signal and present
it in a suitable form.
The receiver is a superheterodyne type similar
to the one described for ultrasonic listening equipment. The usual method is to amplify the signal
at ultrasonic frequency, then mix it with a frequency from a local oscillator to obtain an intermediate frequency that is the sum of the oscillator
239276°-53-6
and signal frequencies. This intermediate frequency might be 60 kc.
The i-f currents which represent the signal are
amplified further and utilized to render the incident sound perceptible in various ways. Note
in figure 4-1 that the signal may leave the amplifier by two different paths. The customary
methods of portrayal are:
1. The amplified i-f currents are heterodyned to
sonic frequencies, which are converted to airborne
sound waves (made audible) by means of a loudspeaker or headphones.
2. The amplified signal voltage may be rectified
and delivered to a "chemical range recorder,"
which utilizes the chemical effect of the current
to record the range on a specially treated paper.
The density of the trace is determined by the
magnitude of the current. Thus the pulse of
current representing the echo signal leaves a spot
that is much denser than that part of the trace
which represents the reverberation and noise.
The range can be read from a scale opposite the
77
spot. An advantage of this method, not possessed
by the others is that it provides a comparatively
permanent record of incident sounds.
3. A range indicator used with earlier models
of echo-ranging equipment has a rotating neon
light which flashes when the signal voltage is
applied to it. The range is read from an adjacent
scale at the time of the flash.
4. The amplified voltage may be rectified and
applied to a cathode-ray oscilloscope by the following methods:
a. The spot of this indicator is usually made
to move along a vertical y axis to indicate range.
The rectified voltage may be applied so as to
cause the spot to deviate from straight-line motion
(deflection in the direction of the x axis). The
echo is then recognized by a greater x-axis deflection than that produced by reverberation.
b. In a second method of portrayal involving
the use of a cathode-ray oscilloscope, the spot
always moves in a straight line to indicate range.
Its brightness is controlled by the rectified voltage
from the receiver, so that the echo appears as a
bright spot on the relatively dim, or invisible, line
traced by the spot in the absence of an echo. This
method is called z-axis portrayal.
It is possible to combine x- and z-axis portrayal.
Training Device and Bearing Indicator
Because the transducer is directional it is
necessary to provide some method of rotating it
in the horizontal plane, so that sound may be
projected in any direction. The device for rotating the transducer is called the training device.
The training device is power-operated by one of
two methods-(1) an amplidyne system or (2) a
thyratron system. Regardless of the method, the
operator is able to control the position of the
transducer.
To be able to train the transducer is not enough.
The operator must be able also to determine the
actual direction in which the transducer is trained
and to read accurately either its true or its relative
bearing. Bearing information is obtained from a
device known as the bearing indicator.
Range Indicator
The timing device for measuring the time
between transmission and echo is basically nothing
more than an elaborate stop watch. It is called a
range indicator or range recorder as the case may be.
The range indicator is a large motor-driven contactor that rotates a light behind a translucent
scale. The scale is calibrated for various maximum
ranges. When the light passes zero on the range
scale the keying contacts are closed and the transmitter sends out a signal through the transducer.
The transmission may last about one twenty-fifth
of a second. When the keying contacts are broken
the receiver is connected to the transducer and any
echo received causes the rotating light to flash opposite the range corresponding to that from which
the echo was received.
This procedure is exactly the same as that used
in the first measurement of range when an observer held a stop watch, which he started when
the transmission was made. He stopped it when
he heard the echo. Because an ordinary stop
watch gave very poor results, the British made a
special one that speeded up the motion of the
second hand. The United States Navy then improved on this method by developing the automatic type just described.
If the maximum range desired is 1,000 yards, the
rotating light must make one revolution in the
time required for the transmitted sound to travel
1,000 yards and return to the ship. If the velocity
of sound is 4,800 feet per second, or 1,600 yards per
second, the time for the sound to travel a total of
2,000 yards can be found from the equation
r=vt, or t=r/v, (4-1)
where r is the range in yards, v the velocity in yards
per second, and t the time in seconds. If the
values given in the example are substituted in
equation (4-1),
t=2,000/16,000= 1.25 seconds.
The time for a 1,000-yard range is 1.25 seconds.
This is a convenient time unit to remember because it is the time per thousand yards of range.
78
If the time for a 5,000-yard range is desired it is
necessary only to multiply 1.25 by 5 and get 6.25
seconds.
The foregoing calculations indicate that the rotating light must make one revolution every 1.25
seconds for a maximum of 1,000 yards and that it
must key the transmitter each time the light passes
zero (once each revolution).
The range recorder was developed by the British
still later than the range indicator and was used
in World War II. The version used by the United
States Navy was an improvement over the British
model, but the principle was exactly the same. A
recording paper was treated so that an electric
current passing through it would make a mark on
it. This paper was made to move at a uniform
rate by a motor. This uniform rate of paper motion gave a time axis for the range plot. A stylus
was caused to move perpendicular to the motion of
the paper at a rate proportional to the echo-ranging
velocity of sound, or 800 yards per second. The
motion of the stylus gave a time-range plot of the
echoes. When received, the echo causes a current
to pass from the stylus through the paper and
leave a mark on it opposite a range scale placed
over the paper. The range recorder has the advantage of "memory" over the range indicator.
With the range indicator, the flash of light is gone
once it is made, and if the observer misses it he
cannot get a second look. The recorder, however,
gives a permanent record of each echo.
The recorder also operates the keying relay.
The transmitter is keyed just as the stylus of the
recorder starts to move across the paper. The
position of the stylus at any time is then proportional to the range.
Transducers
It has been pointed out in chapter 1 that a
vibrating body with dimensions that are small
compared to the wavelength of the sound, radiates
sound energy in all directions. If, however, the
dimensions are large compared to the wavelength
of the sound, the propagation becomes directional.
Radiation from emitters of the first type is called
spherical radiation; that from emitters of the
second type is called directional radiation.
In underwater sound, the important consideration is the production of directional transducers.
It is important to know the direction from which a
sound is heard or received. In some systems, the
sound emitted is from a cylindrical source and is
transmitted horizontally in all directions at the
same time. The vertical dimension of the beam,
however, is made narrow and sharp. Even with
this type of transmitter, it is important to receive
with a directional transducer.
In sonar a transducer is a device which may
convert electric energy into acoustic energy in the
surrounding water. Such a transducer may also
convert acoustic energy from the surrounding
water into electric energy. It is both a transmitting and a receiving device. The term "projector" is commonly used for the device the
specific function of which is to transmit sound
energy into the water. The hydrophone is a
device used specifically for converting sound
energy in the water into electric impulses in the
receiver system.
ULTRASONIC SOUND SOURCES
Sound waves having frequencies above the
audible range have been produced and used in
laboratories for many years, but only in relatively
recent years has it been possible to generate such
waves of sufficient energy for practical use. The
most common method of producing ultrasonic
sound at the present time is by causing formed
bodies to vibrate at a high natural frequency
(resonance) by the application of rapidly oscillating electric voltages.
Magnetostriction Effect
The change in length of a rod or tube of ferromagnetic material when it is placed in a magnetic
field parallel to its length is called magnetostriction.
Nickel, annealed cobalt, and a few alloys of nickel
possess a more pronounced magnetostriction effect
than other metals.
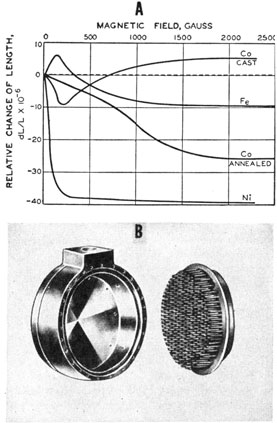
The phenomenon is not related in any simple
manner to other magnetic properties. Figure 4-2,
A, shows the relative change in length dL/L, as a
function of field strength in gausses, for several
materials. The change in length, although small,
79
Figure 4-2 -Magnetostriction transducer. A, Magnetostriction in iron, nickel, and cobalt; B, construction of a magnetostriction transducer head.
depends upon the strength of the magnetic field,
but is independent of the direction of the field.
In addition, its magnitude depends on (1) the
material, (2) its heat treatment and present
temperature, and (3) the degree to which it was
previously magnetized.
Figure 4-2, A, shows that nickel possesses the
property of magnetostriction to a much greater
degree than any other metal. It decreases in a
fairly linear manner for an increasing field strength
up to about 200 gausses. If the field is increased
beyond this value, the additional change becomes
extremely small. The maximum relative change
in length is about 40 parts in a million. However,
because Young's modulus for nickel is high
(30 X 106 lb/in2), a large force is exerted against
anything that resists this small change in length.
Magnetostriction is reversible. If a previously
magnetized rod of nickel is stretched, the magnetization of the rod is decreased; if it is compressed
(in the direction of its length), the magnetization
is increased.
Magnetostriction Sound Sources
Magnetostriction becomes a source of sound
waves when a nickel rod is subjected to an alternating magnetic field by winding a coil of wire around
it and sending an alternating current through the
coil. The rod is shortened periodically in response
to the changing field. Because the shortening of
length is independent of the direction of the field,
the rod is shortened when the current goes through
the positive half of its cycle, regains its length as
the current becomes zero, and is shortened again
when the current goes through the negative half of
its cycle. Thus, the rods goes through two cycles
of motion while the current completes one oscillation. The doubling of the rod vibration frequency can be prevented by subjecting the rod to
a constant magnetic field with properly arranged
permanent magnets or by sending a constant direct
current (polarizing current) through the coil.
Figure 4-2, A, shows that if a nickel rod is initially
shortened to some point on the steep portion of
the curve by placing it in a constant magnetic
field and is further subjected to the magnetic
strains imposed by an alternating current, it can
be made to shorten and lengthen in step with the
alternating current. The polarizing magnetic
field not only prevents a doubling of the frequency
of vibration of the rod, but also allows operation
on the steeper and more linear portion of the
curve. This characteristic is an important
advantage.
The natural fundamental frequency of vibration,
F, of a rod of length L is
F=(½L) (M/σ)½ (4-2)
where M is the modulus of elasticity and σ is the
density of the material. If a current of this frequency is sent through the coil, the amplitude of
oscillation is a maximum; relative changes in
length may be of the order of 1 in 10,000. Calculations using equation (4-2) show that a rod of
nickel 5 inches long has a fundamental frequency
of vibration of about 20 kc; and that one 1.6
inches long resonates at 60 kc.
80
If a nickel rod is set in vibration in the manner
just described, sound waves, with a frequency
determined by the frequency of the magnetizing
current, are emitted from the end of the rod. To
obtain the maximum possible intensity, a practical
transducer is constructed by embedding the end
of several hundred small nickel rods into a steel
diaphragm of dimensions which ensure that its
resonance frequency is the same as that of the
rods. Each rod is excited by its own coil.
A typical magnetostriction transducer is shown
in figure 4-2, B.
Because of the reversibility of the magnetostriction effect, the transducer acts also as a
receiver. Sound waves impinging on the diaphragm compress or extend the rods; corresponding
changes in the magnetization of the rods induce
alternating currents in the coils, which after
amplification can activate a portrayal device.
Piezoelectric Effect
When subjected to a mechanical stress, some
crystals-such as quartz, Rochelle salt (RS),
ammonium dihydrogen phosphate (ADP)- exhibit electric charges on certain surfaces. This
phenomenon, called the piezoelectric effect, was
discovered by the Curie brothers in 1880. The
electric charges developed are proportional to the
stress applied to the crystal, and the charges are
of opposite sign for compressions and tensions.
Shortly after this discovery, the Curies found the
inverse effect to be equally true-that is, when a
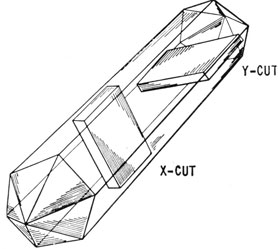
Figure 4-3 -Quartz crystal, showing X-cut and Y-cut plates.
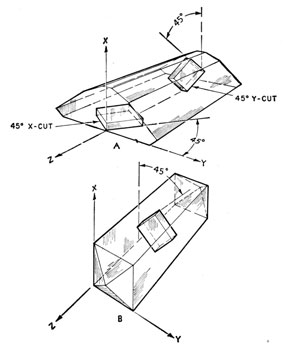
Figure 4-4 -Crystals, showing orientation of rectangular plates
for: A, 45° X-cut and Y-cut RS (top) and B, 45° Z-cut
ADP (bottom).
crystal is subjected to an electric field, mechanical
strains occur in the crystal. Thus, these two
effects are exactly reversible and a direct proportionality exists between cause and effect, in both
magnitude and sign. The fact that magnetostriction is a nonlinear effect, where as the piezoelectric effect is linear, serves as an important
distinction between these two phenomena.
If a piezoelectric crystal is placed between two
electrodes and an oscillating electric voltage is
applied to the electrodes, the crystal vibrates.
Because the elastic properties of such crystals
differ in different directions, the vibrations occur
in different ways, depending on the orientation of
the crystal relative to the electrodes. In any case,
the natural frequency of vibration is given by an
equation similar to equation (4-2), where the value
of the elasticity modulus differs for different
orientations of the crystal.
A crystal as used in this book indicates a
properly oriented piece cut from the mother bar.
If such a crystal is equipped with suitable electrodes and properly mounted and protected it
serves to generate or receive sound signals.
81
Rectangular plates cut from the mother bar at
various angles of orientation are shown for quartz
(figure 4-3), RS (figure 4-4, A), and ADP (figure
4-4, B).
Those crystals designated as 45° X-cut and 45°
Y-cut RS and 45° Z-cut ADP are the only types
of cut crystals that have so far found extensive
practical application in underwater sound transducers in the United States. The use of 45° X-cut
RS is now limited to special and rare circumstances, such as for small hydrophones on long cables
where a preamplifier cannot be used. The use of
45° Y-cut RS has declined greatly. On the whole
45° Z-cut ADP is preferable unless some particular reason (such as low frequency) indicates
otherwise. Quartz has been used effectively in
England, but only because of an inadequate supply of RS and ADP crystals.
Quartz has the advantage of being strong and
insoluble in water, whereas RS and ADP are
fragile and soluble. Solubility is a disadvantage
in all seagoing applications, although it can be
overcome by suitable precautions in the design
and construction of transducers. In the laboratory, on the other hand, solubility is an advantage
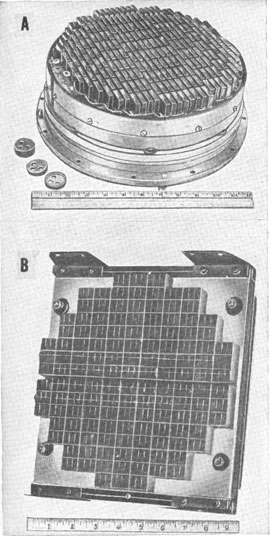
Figure 4-5 -Mounting of transducer crystals. A, Asdic transducer; B, RS and ADP crystals.
in that it makes possible the production of good
artificial crystals, whereas quartz must be mined,
and only a small fraction of quartz crystals found
are large enough and perfect enough for acoustic
purposes. Quartz also has the disadvantage of
being very hard and consequently difficult to cut
and polish. Both RS and ADP crystals are soft
enough to be cut with a band saw and shaped by
ordinary metal-working power tools, if care is
exercised to prevent chipping.
The British Asdic, the forerunner of our sonar,
utilized X-cut quartz crystals. These crystals
were laid flat on a steel plate, as shown in figure
4-5, A, and arranged in a mosaic so that the plate
was adequately covered. An identical plate
(not shown in the figure) was then laid on top of
the crystals, thus forming a sandwich. The assembly was made mechanically rigid by means of
clamps at the edges of the plates. Insulating
washers made it possible to connect the plates
to the terminals of the a-c source.
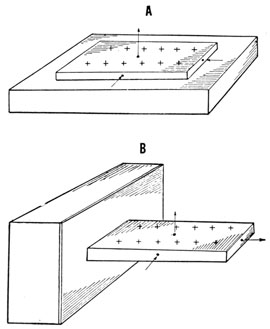
The deformation of the crystal when the voltage
is applied is shown in figure 4-5, A, by the arrows.
When the potential of the upper face is positive,
the thickness increases. Simultaneously, the other
two dimensions shrink. The changes which occur
in the length, width, and thickness are such that
the volume of the plate remains the same.
When the potential is reversed, the deformations are in the opposite direction. The two faces
are not equivalent; hence, care must be taken to
arrange all the plates in a mosaic so that they
expand and contract "in step." Because the plate
is compressed during one-half of the cycle of the
a-c field and extended the same amount during
the other half, it vibrates with the same period as
that of the field. If this is the natural frequency
of the crystal, the amplitude of vibration is a
maximum. The natural frequency of the thickness vibrations, the one used in the Asdic transducer, calculated from equation (4-2) is
F=285.5/t kc, (4-3)
where t is the thickness of the plate in centimeters. However, experiments showed that this
relation is only approximately true, because the
plates generally execute vibrations in other modes
than the ones mentioned; moreover, besides compressional vibrations, vibration due to shear may
82
Figure 4-6 -Types of crystal stacks for transducers.
also be present. Such vibrations, coupled to the
primary ones, tend to change the primary frequency of vibration.
Rochelle Salt and ADP Transducers
Sonar transducers using plates of Rochelle salt
and ADP crystals are mounted so as to utilize the
length vibrations instead of the thickness vibrations, as shown in figure 4-5, B. The two large
faces are coated with a metal foil, and the a-c voltage is applied to the foil. The arrows indicate the
deformation resulting from the indicated charge.
There are many designs and methods used in assembling crystals into a transducer; however, in
general, the crystals are cemented to a single heavy
plate. To prevent short-circuiting, the surface of
the backing plate must be enameled.
Many crystals are mounted on a single backing
plate, as shown in figure 4-6, and sound is radiated
from the free ends of the crystals. They are protected from the sea water by a "window." The
window may serve to separate two liquid media, as
sea water and castor oil, or the crystals may be
attached directly to the inside of the window, the
window not only protecting the crystals from the
action of the sea water but also serving as a means
of support. The space not occupied by crystals,
between the backing plate and window is filled
with carefully purified castor oil. Rubber has been
widely adopted for acoustic windows in crystal
transducers, primarily because of the good impedance match obtainable with sea water but in part
due to its elastic properties, abrasion resistance,
and its electric resistivity.
The resonant frequency of the length vibrations
of the crystal plates, as shown in figure 4-5, is a
function of both the length, L, and the width, w, of
the plate; it is generally multiplied by the length
to form a term called the frequency constant-
FL=64.7-(13.6) (w/L)2 kc. (4-4)
DIRECTIVITY
One important property of a transducer, when
acting as a projector, is the manner in which
transmitted energy is distributed in direction; or
when acting as a receiver, the dependence of its
sensitivity on the direction of the incident sound.
energy.
Let us now look into some of the principles involved in the design of a directional transducer.
Brief consideration has already been given to the
directional properties of a large source-one with
linear dimensions several times as great as the
wavelength of the emitted sound, as compared to
the omnidirectional properties of a "point" source.
Directional transmission of sound results from the
interference of waves spreading out from two or
more poi at sources or from several points on a large
source.
83
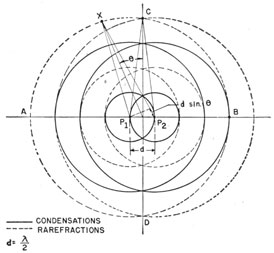
Figure 4-7 -Interference of waves from two sources, for d=λ/2
Consider two point sound sources, P1 and P2,
in figure 4-7, located a distance d apart equal to
one-half wavelength, vibrating in phase with the
same frequency and amplitude. Along CD, the
perpendicular bisector of the line that joins the
two points, condensations from the sources arrive
at C at the same time, as do rarefactions, and the
interference is constructive. Thus the sound pressure at C is the sum of the pressures from each
source. The transmitted sound energy is a maximum along line CD. At point B, on the line
joining the two points, each source again exerts
a pressure. In this case condensations produced
by one source arrive with rarefactions due to the
other and destructive interference results. The
sound pressure at B is also the sum of the pressure
from each source; however, because the waves
from the two sources are arriving at B in phase
opposition, the sound pressure at B is zero.
This special case of two point sources located
one-half wavelength apart constitutes the basis
for a directional transducer, with a maximum
output along the perpendicular bisector of the
line joining the two sources and zero output along
the line joining the two sources. In directions
between AB and CD, the sound pressure resulting
from the combined waves varies with direction.
The polar diagram, B, of figure 4-8, shows a
complete picture of the distribution of sound
pressure resulting from the interference of waves
from two point sources spaced one-half wavelength
apart.
If the two sources are separated by some other
fraction of a wavelength, the difference in the
pressures at points C and B depends on the amount
of the separation. For example, if the separation
is λ/10, the difference in pressure at C and B is
about 5 percent. The smaller the separation of
the sources-that is, the smaller the dimensions
of the whole source relative to the wavelength-the smaller is the difference in pressure between
points on the two lines under discussion.
If the point, X, under observation lies in a
direction making an angle θ with the perpendicular
bisector of the line joining the two sources (figure
4-7), the wave from one source lags behind the
one from the other by a distance, d sin θ, where
d is the distance between the two sources. The
phase lag between the two waves arriving at the
point X is (2πd / λ) sin θ radians. The ratio of the
resultant pressure, p, at point X to the pressure,
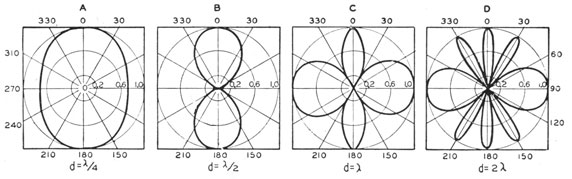
Figure 4-8. -Graphs of equation (4-5) for various values of d.
84
po, at the corresponding point, C, on the normal
(θ=0) may be obtained by vector addition and is
p/po=cos(πd / λ sin θ). (4-5)
Graphs of this function (figure 4-8) normalized
to a maximum value of unity show a series of
maxima and minima for four values of d as θ is
made to vary through 360°.
Practical sources of sound can be considered to
be composed of a number of point sources. By
reasoning similar to that just used, the pressure at
any point in the field surrounding the source can
be calculated. The calculations become extremely complicated for all but the simplest possible arrangements; however, they have been made
for several simple geometrical configurations and
are found in standard works on sound. A brief
discussion and a few equations will be given to
illustrate the problem involved.
There are three types of wavefronts that can be
handled rather simply-that is, waves that are (1)
plane, (2) cylindrical, and (3) spherical. Because
the spherical wave represents a point source and
gives a nondirective field, it is of little use in
transducer design. The plane and cylindrical
cases, however, are useful in that most transducers have either plane or cylindrical radiating
faces.
Mathematical calculations show that the sound
field of any shaped-plane radiator should, close to
the surface, exhibit many maxima and minima
distributed in space both along the axis perpendicular to the surface and in planes parallel to the
surface. Furthermore, such a sound field should
at great distances, exhibit a central maximum
with side lobes of decreasing amplitude with distance from the central axis. The field at a great
distance is of course important in echo ranging,
and the field close in is important in the coupling
between two or more transducers that must be
operated close together.
Most plane radiators in use are bounded by
squares or circles and the chief interest is in the
distant part of their sound fields. Under these
conditions, the directivities are quite easily calculated. Although a mathematical analysis is
beyond the scope of this book, a simple statement
of the types of functions that represent the variation of pressure with the angle, θ, is of interest.
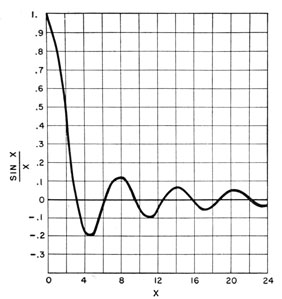
Figure 4-9. -Sin(x)/x as a function of x where x=(πd/λ)sinθ (square plane radiator).
The function that represents the square or
rectangular radiator is
p(x)=(ab/v1) (sin x/x), (4-6)
where x= ka/2 sin θ in the plane perpendicular to
the side a, or x=kb/2 sin θ in the plane perpendicular
to the side b. If only the variation with angle θ is
needed the first term, ab/v1 may be omitted because
(sin x)/x=1 when x=0. A graph of the function
(sin x)/x normalized to unity, is shown in figure 4-9.
The case of the circular radiator was first solved
by Rayleigh. A mathematical expression of the
circular case involves Bessel functions and is not
given here. The graphical representation, however, is very similar to the square radiator pattern
shown in figure 4-9.
The zeros of the (sin x)/x function corresponding to
the nulls between lobes come at x=Nπ, N=1, 2, ..., while the maxima, side lobe peaks, occur at
x=4.5, 7.7, 10.9, 14.1, 17.1, 20.3, ...
85
Other useful facts about these functions are
given in table 6.
Using the (sin x)/x function for the case of a plane
radiator bounded by a square, the expression for
p/po becomes
p/po = sin(ka/2 sin θ) / (ka/2 sin θ), (4-7)
where k is 2π/λ, and a is the length of the side of
the square.
If values of θ are substituted in equation (4-7),
the pressure in all directions relative to pressure
on the normal to the surface can be plotted for
arbitrary values of a and λ. A directivity pattern
is obtained if the results are plotted on polar
coordinate paper.
To achieve a higher degree of directivity, the
linear dimensions of the transducer must be
several times as great as the wavelength of the
sound energy. Sound of 10 kc in sea water has
a wavelength of about 6 inches. To get a minimum degree of directivity at that or a lower
frequency obviously would require a larger transducer surface than is practicable.
Directivity Patterns
It is customary to plot the directivity function
B, or-10 log b (θ), rather than b(θ) itself; but this
means the importance of the side lobes is stressed,
as can be seen from figures 1-4 and 1-5. In echo
ranging, the side lobes are important because an
echo may be received along one of them and considered to be due to the sound of the main beam.
Such a misinterpretation would result in a large
bearing error. Thus the suppression of side lobes
plays an important part in the design of transducers. For example, if the velocity of vibration
over the surface of a plane transducer is not constant, but is less around the edges of the transducer than in the center, the side lobes are always
reduced in magnitude. However, the main lobe
is generally broader. Several methods of calculating the sound field from transducers of variable
surface velocities and phases have been used.
For practical reasons transducers are not
designed with velocities continuously variable but
with step variation over their surfaces. however, the continuously variable velocity method
has given patterns for a wide variety of distributions which are a valuable guide for design and
which also give a perspective to the lobe-suppression problem.
Several cases using two velocity distributions
have been calculated for both circular and square
surfaces. Experimentally, the velocity ratio of 3
TABLE 6 - Useful Facts About Radiation Function
Db down
Formula
Circular Radiator α=radius of circular radiator λ=wavelength
3
θ=sin-1 0.258 λ/α
6
θ=sin-1 0.305 λ/α
∞
θ=sin-1 0.595 λ/α 1st zero
17.8
θ=sin-1 0.818 λ/α max first lobe
∞
θ=sin-1 1.111 λ/α 2nd zero
23.8
θ=sin-1 1.34 λ/α max 2nd lobe
∞
θ=sin-1 1.62 λ/α3rd zero
Square Radiator α=side of square radiator
3
θ=sin-1 0.446 λ/α
6
θ=sin-1 0.605 λ/α
∞
θ=sin-1 1.00 λ/α 1st zero
13.47
θ=sin-1 1.43 λ/α max first lobe
∞
θ=sin-1 2.00 λ/α 2nd zero
18.24
θ=sin-1 2.36 λ/α max 2nd lobe
∞
θ=sin-1 3.00 λ/α 3rd zero
86
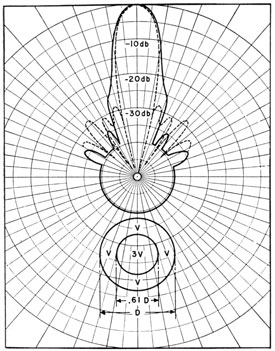
Figure 4-10 -Theoretical and experimental directivity patterns
of a crystal transducer.
to 1 and a diameter ratio of 0.6 to 1 have given
the greatest suppression of side lobes so far in the
circular type, as shown in figure 4-10, which includes the theoretical pattern (broken line) as well
as the experimental pattern (solid line). The
relatively small size of transducers usually limits
the number of velocity steps to two or three.
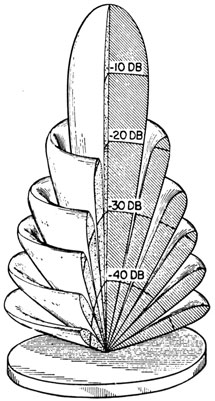
Directivities are usually calculated in some
plane which is normal to the face of the transducer; and because the beam is three-dimensional,
the plane in which a directivity pattern is measured must be specified. If the transducer is a
circular type, the beam may have symmetry
about the normal to the transducer face, as shown
in figure 4-11, where the frequency is 25 kc and
the diameter is 15 inches. However, if the transducer is nonsymmetrical, there exists a directivity
pattern for each possible axis of rotation, and in
general these various patterns are different.
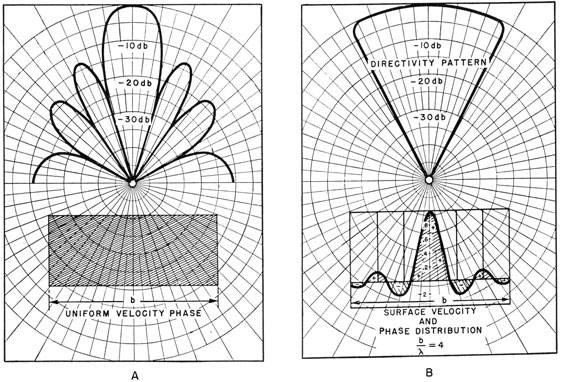
The effects of variations in surface velocities
have been discussed. Phase variations also are
important and both phase and velocity variations
may be used simultaneously. If the radiating
surface is uniform in velocity, the phases in
adjacent lobes differ by 180°. (See figure 4-12, A.)
By a reciprocal theorem, if the radiating surface
is divided into zones the amplitudes of vibration
of which decrease in magnitude and alternate 180°
in phase in a manner similar to the lobe pattern
of a uniform radiator, the pattern should be uniform over a certain arc and have no side lobes.
Such a pattern is shown in figure 4-12 B. If a
linear phase shift across the radiating surface is
used, the main lobe is shifted in direction as
shown by figure 4-13, in which the phase is
shifted 30° per point radiator. Phasing of this
type can be used to train the main lobe electrically while the transducer is fixed.
Theoretically it is possible to fashion the directivity of a transducer into any desired form.
Success in such fashioning, however, requires the
radiating surfaces to perform according to
Figure 4-11 -Three-dimensional directivity pattern for a circular
plate.
87
Figure 4-12 -Reciprocal relation between the surface velocity function and the corresponding directivity function in a
square-plane radiator. A, Uniform velocity in phase; B, surface velocity and phase distribution.
prescribed conditions, leading to one of the most
difficult problems in the construction of transducers. Wide variations in the agreement between theory and experiment are encountered in
transducers of different design, and often are
Figure 4-13 -Shifting of the main lobe by a linear phase
variation over the length of a line of point radiators.
encountered in particular units at different frequencies. These departures from theory vary in
magnitude all the way from negligible departures
to those large enough to render the unit useless
for its intended purpose. The analysis of these
eccentricities can be divided into two parts, one
treating the main, or central, lobe and the other
treating the side lobes. The most important
feature of the main lobe aside from its absolute
intensity is its width, which can be defined by
two points on each side of the center that are 6
db down in intensity from the maximum. These
theoretical beam widths for the square- and
circular-plane radiators with this definition are
θ=2 sin-1 0.605 λ/α (square)
and
θ=2 sin-1 0.305 λ/α (circular).
(See table 6.)
88
In general the experimental beam widths are in
good agreement with theory even when the
accompanying side lobes are in very poor agreement. The width of the central lobe can thus,
usually with good approximation, be predicted
from the over-all dimensions of the transducer.
Detecting submarines under various conditions
establishes requirements for echo ranging that
can be met only by using several transducers. For
general long-range search purposes, it is desirable
to have a relatively wide beam with circular
symmetry and small attenuation. For this
purpose a circular transducer driven at 15 kc is
suitable. For close ranges, a narrower beam can
be achieved by using a transducer driven at 30 kc;
the loss in range due to increased attenuation at
the higher frequency is compensated for by the
greater concentration of the beam and the greater
accuracy in obtaining bearings on a target.
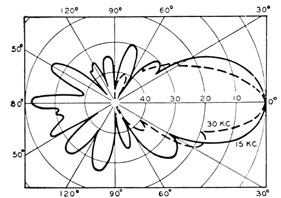
The QGA echo-ranging equipment is designed
along these lines. The two transducers are
mounted in a single dome, although they are
operated independently. The system consists
of two complete equipments, which are practically
identical except that one operates at 15 kc and
the other at 30 kc. Both transducers may be
trained through 360° in azimuth. The 30-kc
transducer may be tilted to 45° for maintaining
contact with submarines that approach close
enough to pass under the horizontal beam. The
directivity patterns for the two frequencies of the
QGA are shown in figure 4-14. The solid curve
is the pattern for the 15-kc transducer; the dotted
curve that for the 30-kc transducer. The numbers
Figure 4-14 -Directivity patterns of QGA echo-ranging transducer.
Figure 4-15. -Directivity pattern of magnetostriction 24-kc
echo-ranging transducer.
on the axis indicate db below the maximum.
The directional characteristics of the transducer
are described by the directivity index which is a
measure of the fraction of the sound energy that
is sent out in the desired direction. The directivity index is expressed by a negative number.
The larger the number numerically the more directional the transducer. The directivity index is
described in more detail later in this chapter. The
directivity index at 15 kc is -18.1 db; at 30 kc,
-23.2 db.
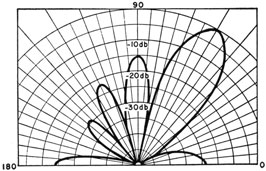
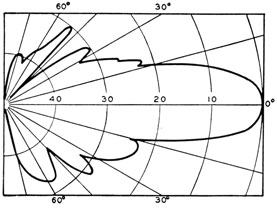
Directivity patterns of transducers used in
some of the older sonar equipments are shown in
figures 4-15 to 4-18, inclusive. Figure 4-15 shows
the pattern of the standard QC transducer, which
consists of 608 hollow nickel tubes arranged on a
circular diaphragm. Numbers on the axis indicate
decibels below maximum. In this gear the tubes
are arranged in circular form, and are pre-magnetized by a polarizing current. The directivity index is -21.4 db.
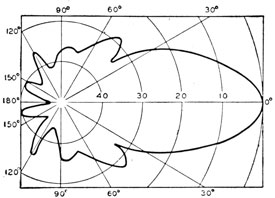
Another form of QC gear, the QCU, has the
directivity pattern shown in figure 4-16. Numbers
on the axis indicate decibels below maximum.
The directivity index is -22.5 db. This unit
consists of 182 nickel tubes spaced in an equilateral triangle. The tubes are premagnetized by
permanent magnets.
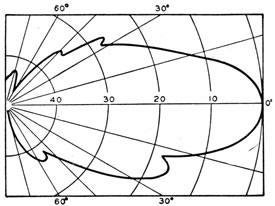
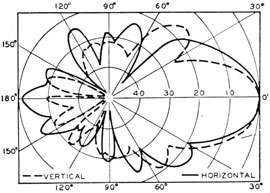
Directivity patterns of two types of QB transducers are shown in figures 4-17 and 4-18. Figure
4-17 is the pattern of the QBF, an echo-ranging
transducer consisting of 450 Y-cut Rochelle-salt
crystals mounted on a steel plate. Numbers on
the axis indicate decibels below maximum. The
directivity index is -25.2 db.
89
Figure 4-18 shows the pattern of the QBG
transducer taken in the horizontal and vertical
planes at 22 kc. Numbers on the axis indicate
decibels below maximum. The directivity index
for the horizontal pattern at 22.5 kc is -17.3 db.
The QBG is a small Rochelle-salt gear intended
for small ships.
When a transducer is used as a hydrophone, the
directivity is generally found to be nearly identical
with its pattern when used as a projector, provided
the electric connections are equivalent for both
sending and receiving. The beam pattern or directivity function B (equation (1-13) expressed in
decibels) gives information concerning the response
of the transducer to sound coming from a specified
direction. Even if the sources of sound are uniformly distributed in all directions, the directivity
Directivity pattern of magnetostriction 25-kc
echo-ranging transducer (QCU).
function gives information about the transducer
to such multidirectional sound fields, because the
response is caused largely by those sources in the
direction of the main lobe. Sources in other directions do not contribute appreciably.
These multidirectional sounds very often interfere with the reception of echoes. The response of
a transducer to these extraneous sound sources,
and their previous measurement under various sea
conditions and at various locations all become
important.
The magnitude of a multidirectional sound field
is most readily specified in terms of its rms sound
pressure, p. This pressure can be directly
Figure 4-17 -Directivity pattern of Rochelle-salt (Y-cut) crystal
echo-ranging transducer (QBF) at 30 kc.
measured by means of a nondirectional hydrophone-that is, one for which b=1 in every direction.
To provide a more accurate bearing determination, the electric connections to the acoustic elements of the transducer may be altered when its
function is changed from projector to receiver.
One method is to split the transducer elements electrically into two halves and connect them so that
through one amplifier the transducer is most sensitive to sounds coming from slightly to the right of
the transducer bearing. Simultaneously through
another amplifier, the transducer is most sensitive
to sounds coming from slightly to the left. The
transducer, as a hydrophone, thus has two directivity patterns, which are not the same as the
pattern when the electric connections are not
altered.
Figure 4-18. -Directivity patterns of Rochelle-salt crystal (45°
Z-cut) echo-ranging transducer (QBG) taken in both vertical
and horizontal planes.
90
Directivity Index
The directional characteristics of a transducer
can be described by stating the fraction of the
sound energy that is sent out in the desired direction. This fraction is found essentially by computing the directivity index.
The directivity factor, K, is the ratio of the total
energy radiated by a transducer to the energy
that would be radiated if the transducer radiated
its maximum intensity in all directions. The
directivity factor is also the ratio of the average
of intensities taken in all directions to the maximum intensity. This ratio evidently provides
quantitative information on the directivity. The
directivity factor may be useful also in computing
the total acoustic power from an absolute-intensity calibration made upon the principal lobe.
If K is unity, the transducer is entirely non-directional, whereas if it is a small fraction, a
large proportion of the energy is concentrated near
the direction of maximum emission, the "acoustic
axis."
If the average intensity is bar(I), and the maximum
or axial intensity is Ia, the directivity index, D,
is defined by
D=10 log K=10 log bar(I)/Ia. (4-8)
For a nondirectional transducer, D is zero; for a
directional one, D is a negative number. The
directivity indices of the various highly directional
transducers mentioned in the preceding paragraphs range from -20 to -26 db.
Measurement of the directivity index is required in order to obtain the efficiency of a transducer. It is unfortunate that these measurements are the most difficult and least accurate of
all calibration tasks. In the present state of the
art very great care is required to obtain an accuracy of ±1 db, and errors of ±2 or ±3 db are
much more usual. For this reason and for theoretical reasons it is desirable to obtain an expression for the directivity factor and index.
If simplifying assumptions are made-such as
uniform loading, uniform phase and amplitude
distributions, and infinite baffle-the directivity
index for a transducer of a given size and shape
can be calculated theoretically from the constants
of the apparatus without involving excessively
unwieldy mathematical treatment. For example,
a circular plate with a diameter, d, that is greater
than 2 wavelengths can be shown to have a
directivity factor of
K=(λ/πd)2, (4-9)
or the directivity index is
D=20 log (λ/πd), (4-10)
where λ is the wavelength in units the same as
those of d.
Generally, D is calculated from the beam pattern, or directivity function, b, which was defined by
b=I/Ia, (4-11)
where I is the intensity at a given point and Ia
is the intensity at a point equally distant from the
source but located on the axis. If b is averaged
over all directions, this average evidently gives K,
and hence D.
When used as a hydrophone, the directivity
index of a transducer is defined as follows:
Sound incident on the hydrophone from a standard source located at a point in any direction at a
distance r from the hydrophone generates electric
power W2. The same source placed on the acoustic axis at the same distance generates electric
power Wa. The ratio W2/Wa can be called b', the
directivity function of the receiver. The values
of b and b' are equal for a given transducer;
unless, the transducer is split for accurate bearing
determination.
As with the projector, b' can be averaged over
the directivity pattern and the value of D calculated as before.
The directivity index of a hydrophone also
determines its response to a multidirectional sound
source. Consider two sound fields, one caused by
a single source located on the axis of the hydrophone, and another by sources distributed equally
in all directions from the hydrophone. Let (1)
both sets of sources result in the same sound
pressure at the hydrophone, (2) Ea be the emf
generated by the single source, and (3) Ei be the
emf generated by the isotropically distributed
sources. Thus
20 log Ei=20 log Ea+D. (4-12)
Because D is a negative number, Ei is less than
91
Ea. This relation has practical importance in the
calibration of hydrophones.
IMPEDANCE OF TRANSDUCERS
Mechanical Impedance
Transducers designed for the generation of ultrasonic waves in water have a construction that is
markedly different from that of the familiar
loudspeakers for the generation of sound in air.
It is not possible to do justice here to all the factors
entering into these designs, but some of the basic
principles are summarized.
The objective, in both constructions, is to set
the medium into periodic motion. To set it into
motion a force must be applied to the medium.
This operation is accomplished most readily by
means of a plate, or diaphragm, to which the force
is applied almost directly. This plate is often a
circular disk. Suppose it is desired to give a point
on its surface the velocity
v=vo cos ωt cm/sec, (4-13)
where vo is the maximum value of the velocity,
ω is 2πf, and f is the frequency of the sound to be
produced. If this velocity is attained, the water
or air in immediate contact with the plate probably
moves with this same velocity when vo, is not too
great. Later in this chapter, the possibility is
considered that the medium does not follow the
motion of the plate, but for the present such lost
motion is ignored.
The first problem is the calculation of the force
required to produce the motion. This force is
proportional to vo and to a quantity Z. This
relation is analogous to that between voltage and
current in an electric circuit, and Z is, by analogy,
called the mechanical impedance of the plate.
The resistance and the inductive and capacitive
reactance that make up the electric impedance
have their mechanical analogies. The value of Z
depends on (1) the mass, size, and shape of the
plate; (2) the mechanical properties of the plate,
such as stiffness; (3) the density of the medium;
(4) the velocity of sound in the medium; and (5) ω.
The force required to drive the diaphragm or
plate at the velocity vo is supplied by an electro-mechanical device called the motor. It is similar
to the ordinary motor in that it converts electric
power into mechanical motion, but, because the
motion is oscillatory rather than rotatory, the
analogy is not very close.
A closer analogy is obtained by considering the
motor as a transformer. Then the velocity Vo, is
analogous to the output current, and the force F
to the output voltage of the transformer. The
radiation impedance is directly analogous to the
impedance of the output circuit of the transformer.
This analogy can be used to describe the effect of
taking a transducer out of water and into air.
Suppose the transducer has been designed to
work under water. Then the lower radiation impedance of air effectively short circuits it. The
transducer heats up, just as an ordinary transformer when it is short-circuited. Very little
power is usefully transformed.
Conversely, a transducer designed to work
efficiently in air is analogous to a transformer
with a low-voltage, high-current secondary. Such
a transducer is not efficient under water, where
the requirements correspond to a high-voltage,
low-current secondary.
The physical differences between a loudspeaker
designed to work in air and a transducer designed
to work in water can be understood by means of
this analogy. The loudspeaker always has a thin
diaphragm of small mass-one that is easily
movable. The motor usually applies the necessary force by magnetic means. In principle, a
small bit of magnetized steel attached to the
diaphragm might be attracted and repelled by a
stationary electromagnet through which an alternating current is passed. Even if such a device
could be immersed in water without physical
damage, the force obtainable in this way would
not be sufficient to move the mass of water in
contact with the diaphragm, and the device would
"stall."
Underwater transducers usually have more
massive diaphragms, which are appropriately
described as plates. The moving part of the
motor is in rigid physical contact with the plate.
The large force necessary to move the plate and
adjacent water is produced by any one of several
methods. It is possible to design electromagnets
to furnish this force, but more motors in use at the
present time depend on the magnetostrictive of
the piezoelectric effect for this purpose. These
effects are capable of producing large forces without the complications that would result from the
use of large electromagnets.
92
SOUND OUTPUT
Electric Power Input and Acoustic Power Output
In rating a transducer, it is essential to know
how much of the applied electric power is available
as acoustic power, and how much of the available
acoustic power is concentrated in a narrow beam.
The electric power input can be measured either
from the applied voltage and the impedance of the
transducer or from the current and impedance of
the transducer.
The acoustic power output can be computed
from measured pressure levels. The total power
is given by the energy flow per second through the
surface of a sphere surrounding the transducer.
The average intensity bar(I), over a sphere of radius r
multiplied by the surface area of the sphere, 4πr2,
therefore is a measure of the acoustic output of
the transducer. Because bar(I)=KIa, where K is the
directivity factor and Ia is the axial intensity,
the acoustic power is 4πr2KIa.
The axial intensity is commonly measured by
mounting a hydrophone at a convenient distance
on the acoustic axis of the transducer and transmitting continuous sound by use of a constant
signal current.
Efficiency and Response of a Transducer
Only that portion of the electric power that is
converted into acoustic power is available for echo
ranging. The efficiency of a transducer is defined
in decibels by 10 log (Po/Pi), where Pa is the acoustic
power output and Pi is the electric power input.
If a system is, for example, 50 percent efficient,
the efficiency is 10 log ½, or -3 db. An efficiency of 10 percent would be -10 db, and so on.
The efficiency of a standard echo-ranging transducer ranges from -2 db to -15 db.
A convenient method of rating a transducer is to
state the axial sound level reduced to 1 yard1 (the
axial source level) per volt or ampere of the impressed voltage or current. This value is called
the response of the transducer.
The acoustic power output P, the axial source
level Sa, and the directivity index D, are related by
the empirical equation
Sa=71.6+10 log P-D. (4-14)
1 The standard unit distance for calibration adopted by the Navy is 1 meter. One yard and 1 meter are not sensibly different for this purpose.
239276°-53-7
The performance of a given transducer is completely described by the response, the directivity
index, and the efficiency. The characteristics of
some standard echo-ranging transducers are listed
in table 7.
TABLE 7 - Characteristics of Some Standard Transducers
Code
Type
Resonant freq. (kc)
D
Source level (Sa)
Efficiency (db)
QGA-942
MS1
30
-23.2db
85db
-6
QGA-941
MS
15
-18.1
77
-7.5
QBF
RS Y-cut
24
-21.1 (20kc) -23.5 (26kc) -25.2 (30kc)
88.5
-3.6
QBG
RS X-cut
22
-17.3 (22 kc)
33 (22kc) 39 (45kc)
?
QCU
MS
25
-22.5
84
-3.8
QCL
MS
20
-21.4
43
-9.5
QCJ
MS
24
-22.1
46.5
-9.5
Asdic
Quartz
15
-22.0
56
-3.1
1 Magnetostriction.
Limitation of Power Output by Electric Characteristics
It would appear that very long echo ranges
might be achieved by increasing the power input
into the transducer system, and that the only limit
on the available power would be imposed by the
permissible size and weight of the gear. This
supposition is not true. There are two limiting
factors in determining the power output, aside
from structural requirements.
The first of these factors results from electrical
characteristics. The voltage across the face of a
crystal cannot be increased indefinitely, for at a
certain critical voltage a spark passes. This
action is referred to as voltage break-down. Some
idea of the magnitude of the maximum voltage
that can be applied may be gained from the fact
that the specifications for ADP crystals for echo-ranging transducers require that each crystal
must withstand a voltage gradient of 20,000 volts
per inch at a frequency approximately one-half the
resonant frequency for at least 30 seconds.
In magnetostriction transducers a limitation to
the power input is set by the fact that the magnetostriction effect becomes negligible when a
certain critical value of the magnetic field strength
93
is reached. Nickel, for example, exhibits practically no magnetostriction for field strengths
greater than from 200 to 250 gausses. (See figure
4-2.)
Limitation of Power Output by Cavitation
The second factor that limits the power output
of transducers is cavitation.
An acoustic transducer consists essentially of a
vibrating face or piston. The motion of the face
is imparted to the water, in which the disturbance
is propagated as a wave. This process can proceed
efficiently only as long as the water follows the
motion of the transducer face. When this motion
becomes too violent, the face tears away from the
water, with a marked loss of efficiency in the
process of sound production.
This limitation on the output of a transducer is
thus closely related to the phenomenon of cavitation. Let p be the rms acoustic pressure at a
point where the normal hydrostatic pressure is po.
Then once each cycle of the sound wave the total
pressure changes from po-1.41p to po+1.41p
and back again. Cavitation may occur whenever
the total pressure tends to become negative.
Accordingly, the greatest rms acoustic pressure
that can be transmitted through a region where
the hydrostatic pressure is po is p=po/1.41. In terms
of sound level,
critical level= 20 log po-3. (4-15)
When po is 1 atmosphere (35 feet of water or 106
dynes/cm2), L is 117 db. When the sound level
exceeds this critical value, cavitation bubbles may
be formed and cause high transmission losses.
Cavitation bubbles are described with wakes in
chapter 2.
Because the acoustic pressure is highest at the
face of the transducer cavitation occurs there
before it occurs elsewhere. This action constitutes the process discussed earlier. As a result of
the process, the power output of the transducer,
for a given motion of the face, is reduced.
Aside from the reduction of power output of a
transducer for a given motion of its face because
the water does not follow the moving face, the
power output may be reduced for other reasons.
Thus, it has been observed in experimental tanks
at the Naval Research Laboratory that small air
bubbles may form on the transducer when it is
warmer than the water. This formation may
occur also under other conditions. Accompanying the formation of these almost invisible bubbles,
the sound output of the transducer for a given
electric input is much reduced. Under similar
circumstances its sensitivity as a hydrophone also
diminishes.
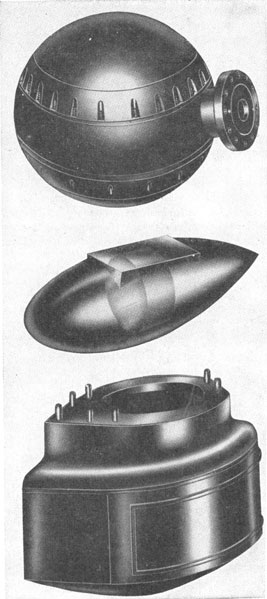
Figure 4-19 -Standard domes.
94
EFFECT OF DOMES
The transducer unit, consisting of the transducer and the shaft that supports it, is usually
installed near the bow of the ship. Because the
housings in which transducers are encased are
usually spherical, they cause excessive turbulence,
and sometimes cavitation, even at moderate
speeds. This action causes excessive background
noise. For this reason, transducers are generally
enclosed in streamlined metal shells called domes.
Several types of domes are in current use by
the Navy. They are all made of corrosion-resistant
steel; the front is very thin so as to form a "window" to transmit the sound; the back is heavy so
as to damp unwanted noise from the propellers.
One type is equipped with a bulkhead just aft of
the transducer, which supports a sound-absorbing
baffle on the forward side and a sound-reflecting
pad on the after side. Both these devices reduce
sound reception through the stern section of the
dome, and the baffle also aids in reducing multiple
reflection within the dome. Some domes are retractable and when not in use are withdrawn into
a sea chest built into the hull.
Some standard domes are illustrated in figure
4-19.
The acoustic effects of the use of domes are two-fold. In the first place, the axial source level of a
dome-enclosed transducer is less than that of the
same transducer without a dome. In the second
place, the directivity pattern of the dome-enclosed
transducer differs from that of the same transducer
without a dome.
The two effects are closely related. It is not
possible to construct domes of materials that are
entirely transparent acoustically. Thus, a certain
amount of multiple reflection occurs inside the
dome. As a result, some of the sound energy that
is emitted by the transducer into the main lobe
of the sound beam is diverted from it. This action
reduces the axial source level.
Any energy diverted from the main lobe, however, must be redistributed in some manner. It is
quite possible, therefore, that new side lobes may
be added to the directivity pattern, for the regular
shape of the dome would preclude a mere random
redistribution of the diverted energy. Moreover,
it is obvious that multiple reflections inside the
dome may affect the original side lobes of the bare
transducer pattern.
The decrease in the axial source level due to the
distortion of the directivity pattern is equal to the
change in the directivity index that ensues when
the transducer is placed in a dome.
In echo ranging, a loss in the transmission reduces the effective range; and the distortion of the
directivity, especially if accompanied by the formation of prominent side lobes, tends to confuse the
determination of bearings. Hence, the various
factors that have been adduced must be considered
in the design of a dome.
Receiver Sensitivity and Background Noise
RECEPTION
Although the several methods of echo portrayal
are quite different, the general principles that
govern them are similar. The echo is only one of
many sounds picked up by the sonar. Each
sound, whether wanted or unwanted, actuates the
portrayal device. The echo must be heard in
spite of the unwanted sounds that are being heard
at the same time, or it must be seen among the
records of these other sounds.
An ideal sonar would respond only to the echo
and not to any other sound. This ideal is unattainable, but steps can be taken to approach it.
For example, in listening to the radio we wish to
hear the broadcast of only one station at a time;
so we tune our set, with the result that it responds
only to the electric waves of the relatively narrow
range of frequencies emitted by the particular
station and not to those of any other. In the same
way, because the echo has a definite frequency,
it obviously is desirable to tune the receiver to
this frequency, thus excluding much of the unwanted sound. Such tuning is more important
with visual than with aural methods of portrayal,
for the ear has the ability to ignore unwanted
sounds and to hear a note of definite pitch even
in the presence of noise.
The sonar receiver can be tuned at various
stages. The first is the so-called radio-frequency
(r-f) stage, in Which the receiver can be tuned to
the frequency of the incoming echo. In the
95
second stage, the receiver is tuned to the intermediate frequency (i-f), which is the first heterodyne stage. Finally it is possible also to tune the
receiver in the audio-frequency (a-f) stage, where
the once-heterodyned signal is heterodyned a
second time to an audible frequency. The tuning
is under the control of the operator, and can be
accomplished at any one stage or in several stages
at once.
Another approach is found in the fact that the
echo is sound coming from a particular direction,
whereas background noises may come from all
possible directions. The unwanted noise can be
reduced by using directional transducers. The
obvious disadvantage of such a receiver is that it
cannot then be alert in all directions simultaneously; but this drawback is offset by the consideration, that, if an echo is received on a directional
sonar, the bearing of its source is known at once.
RESPONSE OF TRANSDUCERS
AND AMPLIFIERS
Response of Transducers
The electromotive force generated by the transducer is a function of the sound pressure on its
diaphragm. This response of the transducer
partially determines the response of any system
into which it may be connected. Transducer
sensitivity at the frequency, F, is defined as the
emf developed in the transducer when it is in a
sound field of frequency, f, and in a rms pressure
of 1 dyne/cm2. If e is the emf generated by the
transducer when in a sound field of p dynes/cm2,
the ratio
k=e/p (4-16)
defines the sensitivity of the transducer. It is
measured in volts/dyne/cm2. The quantity
K=10 log k2= 10 log e2/p2=20 log k, (4-17)
is called the response of the transducer. The
response is the decibel ratio of the power generated by the transducer per ohm resistance of the
external circuit to the intensity of the sound field
at the transducer. If P is power per ohm resistance and I is the intensity of the sound, then
because P=e2 and, I is proportional to p2
K=10 log e2/p2=10 log P/I. (4-18)
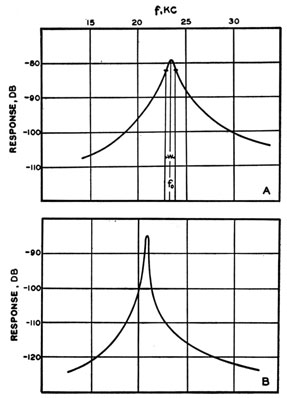
Response Curves
The graph showing the response at each frequency is called the response curve of the system. The response curves of two QC magnetostriction
transducers are shown in figure 4-20. They
Figure 4-20 -Response curves of transducers. A, Type QCJ;
B, type QCL.
respond well only to sounds in the neighborhood
of the resonance frequency, Fo. In the case of the
QCJ (figure 4-20, A), Fo is 24 kc-that is, the
transducer is said to resonate at 24 kc. The width,
w, of the resonance peak, shown in the figure, is
usually defined as the frequency separation of the
two points on the curve which are 3 db below the
maximum. In the given curve, w is about 1 kc.
Another commonly specified quantity is the
resonance parameter, Q=Fo/w. If Q is greater than
about 20, the system is said to be highly resonant;
if Q is less than 4 or 5, the system is nonresonant.
The QCJ transducer has a Q of about 24. The
QCL shown in figure 4-20, B, is more sharply.
96
resonant than the QCJ; the w of the QCL is
between about 200 and 300 cycles, and, because
it resonates at 21 kc, its Q is between 70 and 105.
Because of the resonance of these transducers they
are tuned-that is, the echo frequency must be
near the resonant frequency or they will not
respond effectively.
Response of Amplifiers
The amplification ratio of an amplifier is similar
to the transducer sensitivity. It is the ratio of the
output voltage to the input voltage. The response
is defined in terms of amplification ratio in exactly
the same manner that the response of a transducer
is defined in terms of its sensitivity. Response
curves can be plotted for amplifiers as well as for
transducers and the same terminology is applied
to them.
SPECTRUM LEVEL AND RESPONSE TIME
Power Spectrum Level of Noise
The response curve shows the emf generated by
a transducer in responding to a sound of a definite
frequency. Most of the unwanted sounds encountered in echo ranging do not have a definite
frequency, and it is necessary to consider the emf
generated by the transducer in response to such
a sound.
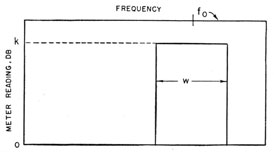
Consider an ideal transducer the response curve
of which is rectangular, as illustrated in figure 4-21.
Suppose that it is possible in some way to vary
both Fo and w, while the transducer is exposed to
a constant noise. The emf generated then depends
on both Fo and w. If w is made successively
smaller, the power P of the generated emf finally
becomes proportional to w-
P=k2I(Fo)w. (4-19)
The two other factors in this equation are k, the
sensitivity of the transducer to a sound of the frequency Fo, as defined by equation (4-16) and a
function I(Fo), which is characteristic of a particular noise. This function has not been given
a simple name but is sometimes called the intensity
of the noise in a 1-cycle band. The function
N(Fo)=10 log I(Fo) (4-20)
is called the spectrum of the noise, or its spectrum
level at Fo.
To distinguish the spectrum of a continuous
noise from that of a pulse, it is often necessary to
call that of a continuous noise a power spectrum
and that of a pulse, an energy spectrum. Equation
(4-19) then becomes
10 log P=K+N+ 10 log w. (4-21)
For all wide-band noises encountered in echo ranging, equation (4-19) is sufficiently accurate even
for resonant transducers like the QC, the response
curves of which are far from ideal. Equation
(4-19) indicates that the power generated by a
wide-band noise is proportional to the width of
the resonance peak of the transducer.
Energy Spectrum Level of a Pulse
Although the intensity of an uninterrupted,
constant sound is most conveniently measured in
terms of power (energy per second), the intensity
of a pulse is better measured in terms of energy-
that is, power times duration. The energy spectrum of a pulse can be defined in much the same
manner as the power spectrum of an uninterrupted
sound.
If the pulse consists of a train of sinusoidal
waves, it will have a fairly definite pitch, say F
cycles per second provided the train contains many
complete waves. The definite pitch of such a pulse
indicates that its energy spectrum has a sharp
maximum at the frequency F. If the number of
waves in the train is diminished, the height of this
peak decreases, and its width w increases. The
complete mathematical discussion of this effect
can be given in elaborate form, but the essential
result is simple.
Let the duration of the wave train be τ seconds.
Each wave requires 1/F second to pass a given point.
Therefore, if the wave train contains many complete waves, τ >> 1/F The duration of the pulse
Figure 4-21 -Response curve of an ideal transducer.
97
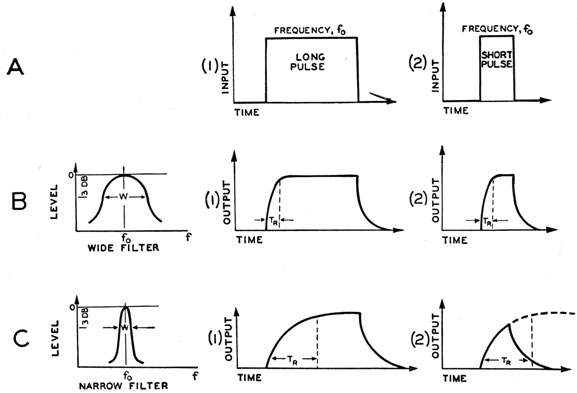
Figure 4-22 -Response time of a filter in relation to its bandwidth.
τ and the width w of the resonance peak of the
pulse are connected by the approximate equation
wr=1. (4-22)
The greater width of the resonance peak
associated with a shorter pulse duration makes it
appear that a short pulse can be analyzed into a
much wider group of frequencies than a long one.
The human ear behaves in a manner consistent
with this mathematical relation. If a listener
hears pulses consisting of trains of sinusoidal
waves, his sensations depend on the number of
waves in the train. If the pulse contains many
complete waves, the sensation is that of a short
tone of well-defined pitch. As the number of
complete waves diminishes and the pulse becomes
shorter the listener finds it more and more difficult
to be sure of the pitch. Finally, very short pulses
consisting of only two or three waves lose all tonal
characteristics and are best described as "clicks"
or "pops."
Response of Band Filters to Short Pings
Because the width of the spectrum peak of a
pulse is inversely proportional to the pulse duration, it might be expected that in designing filters
intended to pass only a restricted group of frequencies centered at F cycles per second the duration of the pulse would have to be considered.
As a very short pulse has a wider peak it seems
obvious that if a filter is to pass it with minimum
diminution of intensity the width of the filter
must be greater than is necessary for a longer
pulse with its proportionally narrower peak.
This fact can be stated in another way. There
is a relation between the width of the filter and
the speed with which it responds to sudden changes
of input. This relation is illustrated in figure
4-22. The two upper graphs, A (1) and A (2),
represent the input of a long and a short pulse,
respectively. The graph at the left in row B
shows the frequency response curve of a wide
98
filter; the one at the left in row C, that of a narrow
filter. The remaining curves-B (1), B (2),
C (1), and C (2)-represent the outputs of the
filters when excited by the corresponding pulse
shown in A (1) and A (2).
The input in each case begins and ends gradually. It requires a certain time interval, tR, to
come anywhere near its maximum value. theoretically, it requires an infinite time to reach its
maximum value; hence the rather vague working
of this sentence. This time interval is indicated
in each of the diagrams, which show that it is
much shorter in the wide filter, B, than in the
narrow one, C. The relation between the response
time, tR seconds, and the width, w cycles per
second, of the filter is given by the inequality
tR greater than or equal to 1/w. (4-23)
In a well-designed filter the equality may be
assumed to hold; but a poorly designed filter may
have a response time considerably greater than 1/w.
The diagrams show that if the pulse is long
enough, as illustrated by the curves B (1) and
C (1), the response time is short enough that the
pulse can come near its maximum value even in
the narrow filter, C (1). If the pulse is short,
however, as illustrated by the curves B (2) and
C (2), the response time of the wide filter is short
enough to permit the pulse to come up to maximum
value B (2), but this principle does not apply to
the narrow filter, C (2). In C (2) the input
ceases before the response time has elapsed. Thus
the output is always less than its maximum
value.
It follows that if a receiver is to respond fully
to pings of a length ro yards, the duration of which
is thus
2ro/v = ro/800 seconds,
where v is 1,600 yd/sec, the pass band of the receiver must be at least 800/ro cycles per second.
LIMITATIONS ON THE USE OF SHARPLY
TUNED RECEIVERS
Besides the limitation on filter width set by the
ping length, there are several other factors that
prevent full exploitation of tuning as a method of
eliminating the unwanted sounds. Several of
these factors will be discussed briefly.
Doppler Effect
Even if the frequency of the emitted signal remains constant, the frequency of the echo is not
always the same, but depends on the rate at which
the range of the target is changing. Therefore,
the tuning cannot be made indefinitely sharp
without endangering the reception of echoes from
targets with a high range rate.
The change in frequency due to the Doppler
effect can be very great.
In chapter 3 it was shown that if the emitted
frequency in kilocycles is Fo, and the range rate in
knots is dR, the frequency of the echo is changed
by f cycles per second. Because the Doppler
effect is to shift the frequency by 0.7 cycle per
kilocycle per knot of range rate,
f=0.7 FodR cycles per second. (4-24)
This change, f, is an increase if the range is
closing and a decrease if it is opening. Because
the sonar vessel has a usable speed of 20 knots and
the possible targets have speeds of 20 knots, the
range rate can be 40 knots opening or closing. If
the sonar vessel is emitting 24-kc sound, the doppler shift is 672 cycles per second. This condition
requires that the band pass be twice that width, or
1,344 cycles per second. To overcome this difficulty (as previously mentioned), a device called
own doppler nullifier (ODN) and target doppler
nullifier (TDN) is used.
This device automatically adjusts the output of
the receiver to the desired frequency, for example,
800 cycles per second. These doppler nullifier circuits are shown in chapter 7.
Figure 4-23 -Relation of the range rate to the relative bearing
of the target.
99
The range rate depends not only on the speeds
of the sonar vessel and the target, but also on the
relative bearing of the target. This principle is
illustrated in figure 4-23, which shows three successive positions of two vessels passing on constant
courses at constant speeds. At time 1 the target
is off the port bow of the sonar vessel, and the
range is closing rapidly. At time 2 the target is
at the point of closest approach and the range
rate is zero. At time 3 the target is on the port
quarter and the range is opening rapidly. Thus
in this case, the change from closing to opening
range occurs continuously as the bearing changes.
Reverberation
Reverberation occupies a peculiar position, as
it is in some ways an unwanted sound and in others
a wanted sound. From the standpoint that reverberation can mask the echo, it is unwanted. Considered in this light, it unfortunately has a
frequency that is very close to that of the echo,
so that extremely sharp tuning is needed if the
receiver is to respond to the echo and not to the
reverberation.
Reverberation consists essentially of a large
number of echoes; hence its frequency also is
affected by doppler. Because the scatterers
responsible for the echoes are presumably at rest in
the water, the range rate at which the vessel is
approaching these scatterers and the magnitude
of the accompanying Doppler effect are determined
solely by the speed of sonar vessel and the relative
bearing of the sound beam. For this reason the
Doppler effect of reverberation is called own doppler. If an echo is received from a moving target,
there is a difference between the echo frequency
and that of the reverberation. This difference is
called target doppler. The magnitude of the target doppler is an important factor because it is a
measure of the speed and approximate relative
bearing of the target. From the standpoint that
it enables the determination of target doppler,
reverberation is a wanted sound.
When the difference in frequency between echo
and reverberation is large and the echo is detected
by ear, the masking power of reverberation is
reduced. Reverberation then functions primarily
as a wanted sound. On the other hand, when the
speed of the target through the water is small or
at right angles to the transducer heading, the
unwanted masking effect of reverberation is dominant. This unwanted effect is always the dominant one with visual methods of portrayal, because
the range recorder cannot distinguish between
sounds of various frequencies.
Own Doppler Nullifier
The major limitation on the use of narrow-band
receivers is the necessity for allowing echoes of
many different frequencies to pass through the
receiver. The limitation would not be so severe if
the sonar vessel were at rest, or if its motion did
not affect the frequency of the echo. The speed
of most targets is relatively small, and the width
of the receiver band could be reduced if target
speed were the only cause of Doppler shifts.
It would be possible to operate with a narrow-band receiver if the operator could constantly
change the frequency of the transmitted signal by
an amount just sufficient to compensate for own
doppler. The reverberation frequency would then
remain constant, and the only frequency shift to
be accommodated would be that of target doppler.
Because of the necessity of sweeping the sound
beam over a wide range of bearings, the own doppler changes rapidly, and it is not feasible for the
operator to make this adjustment and still perform
his other duties. The ODN automatically accomplishes this result to a high degree of approximation.
When the ODN is set for some one frequency,
for example, 800 cps, the local oscillator frequency
is automatically adjusted to give this value during
the first fraction of a second after transmission;
thereafter the adjustment remains constant. In
this way the frequency of the reverberation is kept
quite constant, and considerably narrower filters
can be used in the receiver. The ODN is less
useful against submarines capable of high underwater speeds. The TDN is employed to return
any echo to 800 cycles at the receiver output.
Sonar Location
CONSIDERATION OF VESSEL HULL DESIGN
Sonar equipment is installed in many types of
vessels ranging from small patrol craft to large
aircraft carriers and submarines. Each type of hull
presents different problems of sonar installation,
depending on its width, length, draft, material, and
100
construction. Although wooden hulls have a
greater attenuation for hull-born noise, they have
several disadvantages. They are usually very
short, are of shallow draft, and are not a stable
platform for sonar equipment. The best sonar
platform is a long, deep-draft hull.
Selection of Transducer Location
There are no fast rules for the location of a sonar
transducer. However, certain factors must be
taken into consideration. Because the screws are
the primary source of noise, the transducer should
be located as far from them as possible. In most
deep-draft vessels, the screws are high above the
keel, so that if the transducer is located well
forward, the hull acts as a shield or baffle and
allow, the equipment to look in all directions with
less interference from the screws.
Another reason for locating the transducer well
forward and deep is because of the pressure
gradients created by the bow wave.
The pressure of the water around the bow is
increased and as the water moves aft the pressure
decreases toward normal. When the pressure
of sea water is reduced it begins to gas, causing
the water to become bubbly. If the transducer
were located in or aft of the point at which this
condition occurs, a great number of bubbles would
strike the face of the transducer with about the
same effect as small steel pellets and thus create
a very objectionable water noise.
The magnitude of the bow wave depends on the
speed of the vessel. Therefore, its normal tactical
employment must be considered when selecting
the transducer location. Because the normal
tactical speed of the vessel is known the normal
magnitude of the bow wave is known, and the
Neidemair formula can be used to locate the
transducer in the high-pressure area. According
to the Neidemair formula, the number of feet aft
of the bow that the transducer should be located
is determined by KV2, where V is the ship's speed
in knots and K is a constant with an average value
of 0.14.
There are two reasons why the transducer is
not located at the bow. First, the bow does not
provide enough width for mounting a standard
sonar dome, and second it is not stable. On small
craft it does not require a heavy sea to cause the
vessel to pound so that the keel section near the
bow is "twixt wind and water." Even if this
condition didn't cause mechanical damage to the
transducer it would cause too many of the transmissions to be quenched.
Use of Fairing on Hull To Reduce Self-Noise
Any protuberance ahead of the transducer
probably is a source of noise; therefore, such
things as the pitometer log and water intakes
should be aft of the transducer. Loose or badly
formed rivets are a source of noise. From these
statements it should be clear that the flow of water
along the hull must be as smooth as possible and
any possible point of turbulence must be smoothed.
Fairing is used on hull openings below the
waterline to smooth the flow of water. It is made
of an elevated,. half-round section of metal that
surrounds the opening. It may be either circular
or shaped like a tear drop.
Reduction of Noise from Local Machinery
All machinery aboard ship contributes to the
over-all self-noise of the vessel. Because the
machinery is mounted on the hull and because the
hull is a good conductor of sound, the transducer
must be insulated from the hull in order to reduce
direct coupling of this noise into the sonar equipment. The transducer is generally insulated by
a rubber gasket. A noise survey of the machinery
may disclose that certain pumps, motors, or generators are excessively noisy. If after inspection
the noise cannot be laid to mechanical trouble in
the noisy equipment, it should be determined
whether the machinery can be mounted so that
the noise it generates is not directly coupled to the
hull.
The problem of local noise differs from ship to
ship and requires individual noise surveys.