This chapter discusses attempts that are being
made (1) to cope with some of the special operational difficulties encountered in trying to obtain
information by echo ranging and (2) to apply such
information to tactical problems. From this information the military specifications of new equipments are obtained.
SEARCH OPERATIONS
Echo ranging is used by the Navy for several
purposes, not all of which are directly connected
with naval warfare. Echo ranging as an aid in
antisubmarine warfare is only one of its applications, though perhaps it is the most important and
dramatic. Regardless of its use, the success of
echo ranging is conditioned by the systematic execution of a carefully considered operational plan.
Such a plan is based on the consideration of the
following functions that underwater echo ranging
can successfully perform:
1. To establish contact with the target by using
sound.
2. To maintain contact with the target and identify it.
3. To obtain accurate determinations of the
range and bearing of the target.
4. To determine the rate at which the range and
the bearing are changing-that is, the range
rate and bearing rate.
Each of the last three of these functions successively depends on the preceding ones.
The present discussion is restricted to the application of echo ranging to search operations in anti-submarine warfare as prosecuted by a surface
vessel.
In a search operation three different missions can
be assigned to the surface vessel or squadron.
These missions are:
Hunt: To find as many enemy submarines as
possible with little or no information as to their
position at any earlier time.
Location: To find a specific enemy submarine
whose position at an earlier time is known with
reasonable accuracy.
Screen: To establish a zone (the screen) around
a friendly area (a shipping lane or a moving convoy) so that all enemy submarines must pass
through the screen in order to attack, and then to
detect all enemy submarines while they are in the
screen.
There are several differences among these three
assignments. Hunt and location missions are offensive, and the submarine may be expected to use
evasive maneuvers. The screen mission is defensive, and its objective-the prevention of a successful attack by a submarine-is partly achieved if
the submarine is forced to use evasive tactics.
The success of these missions obviously depends
on the probability of establishing sonar contact-that is, on the probability that when a ping is
transmitted, a recognizable echo will be returned.
Intelligent operational plans can be worked out
only if all the factors affecting this probability are
known and their effects evaluated. The effects of
some of these factors are easily evaluated. For
example, in the hunt operation, success may be
equally probable if the echo-ranging vessel searches
a wide area superficially or a smaller area intensively. In the location mission, success is assured
if the vessel has sufficient speed to make an exhaustive search of a sufficiently large but limited area,
102
provided that self-noise at high speed does not
make the sonar inoperative.
The effects of other factors are not easy to
evaluate. The most important factors to be
evaluated are:
1. Range of the target.
2. Bearing deviation-that is, the difference
between the actual bearing of the target and
the transducer heading.
3. Relative bearing of the target.
4. Depth of the target.
5. Echo strength of the target.
6. Prevailing sound conditions.
7. Speed of the echo-ranging vessel.
To solve the problem of maneuvering a ship so
as to bring the sonar into a position that will ensure
a high probability of obtaining echoes, the cumulative effect of all the factors must be analyzed.
Many operational rules, based on experience and
a small amount of theoretical analysis, have been
formulated. However, no complete solution of
this operational problem has been made.
For this discussion, if it is assumed that adequate data are available on the last four factors
listed, only the probability of establishing sonar
contact based on the range and bearing of the
target need be examined.
Probability of Detection
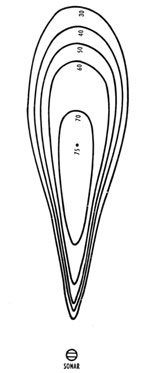
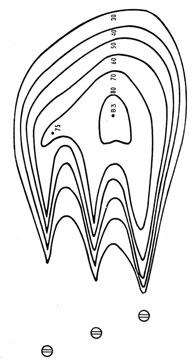
Single ping. -Assume that a target is in the
vicinity of a sonar and that a single ping is transmitted. The detection probability can be exhibited
on a contour map, like the one shown in figure 5-1.
This figure is entirely schematic and is presented
merely to illustrate the discussion of general
principles. It does not represent the facts of any
actual situation.
The position of the echo-ranging sonar is indicated at the bottom of figure 5-1. If the target is
situated on a given contour, the number shown
on the contour designates the probability of detection. Such a number is called the detection probability. For example, if a target is on the 60-percent
contour, a single ping will return a recognizable
echo 60 percent of the time. If the target is inside
the 60-percent contour, this probability will be
greater.
For all search operations, it is important that
the area of each contour be as large as possible.
The maximum value of a typical detection probability also should be large. In order to obtain a
single number that describes the contour diagram,
the areas between any two adjacent contours are
multiplied by the average value of the detection
probability, and the various products thus obtained are added. The result is called the effective
search area of a single ping. For example, the area
between the 30-percent contour and the 40-percent
contour is measured, and this quantity is multiplied by 35 percent, the average probability in the
area. Then the process is repeated for all the
zones, and the sum of the individual products is
computed.
In order to obtain a larger area, the beamwidth
could be increased. An increased beamwidth, however, would make the bearing determination less
accurate, and thus the gain of one advantage would
cause the loss of another. In the design of an all-purpose pinging sonar the various requirements
must be balanced carefully against one another.
Figure 5-1. -Detection probability of a stationary target and a
stationary sonar.
103
Successive pings.-In practice, surface vessels do
not rely on a single ping for detection, although the
tactical situation may force a submarine to do so.
The analysis of the advantage of repeated pings in
operational practice is complex; only a few major
principles can be discussed here.
The simplest case is that in which both sonar and
target are at rest and in which two pings are sent
out. Then it is possible for an echo to be recognized (1) on both the pings, (2) on either of the
pings, or (3) on neither of the pings.
Let W1 be the probability that a single ping will
return a recognizable echo for the given position of
the target. Then the probability that the echo
will not be detected is evidently
1-W1. (5-1)
Let us assume that the detection probability for
the second ping is the same as if the first ping had
not been transmitted. This condition is not
likely, for the operator may have been doubtful of
the echo from the first ping and may have ignored
it, but a doubtful echo from the second ping is,
under these conditions, very likely to be considered certain-especially if a range recorder is
used. This effect becomes increasingly important
as the number of pings increases. For simplicity,
however, memory and comparison effects are
ignored.
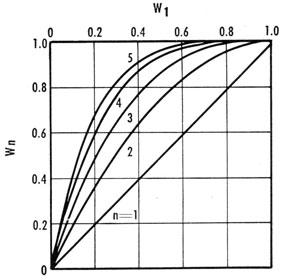
Figure 5-2.-Detection probability Wn for n pings in terms of
the detection probability W of a single ping.
The probability that the second echo will not be
detected is also
1-W1.
The probability that neither of the two echoes
will be detected is the product of the two probabilities-
(1- W1)2. (5-2)
Hence the probability that at least one of the
two echoes will be detected is
W2=1-(1-W1)2. (5-3)
If n pings are transmitted, the detection probability is
Wn= 1-(1- W1)n. (5-4)
Graphs of this equation for several values of n
are shown in figure 5-2. Figure 5-2 shows an
increase of detection probability with each successive ping. This increase is most rapid for intermediate values of W1. If W1>0.5, five pings
will make detection practically certain.
Effects of motion. -If the echo-ranging vessel is
in motion, the calculation of the probability of
making sonar contact with a target by using successive pings becomes more complicated. If the
target also is in motion, additional complications
arise.
In the case of a stationary target and a moving
echo-ranging vessel, suppose that the target was
on contour W' of the first ping but that the motion
of the sonar has resulted in placing it on contour
W" of the second ping. Then, by reasoning
similar to that in previous paragraphs and again
i by ignoring memory and comparison effects, the
probability of detection by either or both of the
two pings is
W=1-(1-W')(1-W"). (5-5)
Values of this function are given in table 8.
TABLE 8.-Detection Probability for Two Pings-Moving
Sonar and a Stationary Target
W"\W'
0.1
0.2
0.3
0.4
0.5
0.6
0.7
0.8
0.9
0.1
0.19
0.28
0.37
0.46
0.55
0.64
0.73
0.82
0.91
.2
.36
.44
.52
.60
.68
.76
.84
.92
.3
.51
.58
.65
.72
.79
.86
.93
.4
.64
.70
.76
.82
.88
.94
.5
.75
.80
.85
.90
.95
.6
.84
.88
.92
.96
.7
.91
.94
.97
.8
.96
.98
.9
.99
104
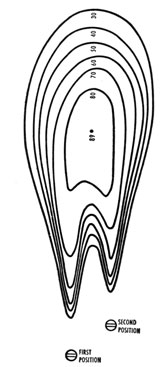
Figure 5-3.-Detection probability of a stationary target and
a moving sonar.
Arbitrary values of W' are arranged in the top
row, those of W" are in the left-hand column, and
the corresponding values of W are in the body of
the table. For example, suppose that when the
first ping is transmitted, the target is on the
60-percent contour and that the motion of the
sonar has resulted in placing it on the 50-percent
contour for the second ping. Then W' equals 0.6,
W" equals 0.5, and from the table, W equals 0.8.
Table 1 can be used to construct a contour map
similar to that in figure 5-1. Such a map is shown
in figure 5-3. The two successive positions of the
sonar are shown at the bottom. It is assumed that
the detection probability of each ping is identical
with that diagrammed in figure 5-1, and that the
pings were transmitted with the same transducer
heading. The motion of the transducer between
pings has been greatly exaggerated for purposes of
illustration.
Comparison with figure 5-1 shows that each
contour-for example, the 50-percent contour-has greatly expanded and encloses more than twice
the area of the same contour for a single ping.
Moreover, the maximum value of the detection
probability has increased from 75 percent for the
single ping to nearly 90 percent for the two pings.
Consequently, the effective search area of the two
pings is more than doubled.
The amount by which the effective search area
of the overlapping pair exceeds twice the area of
a single ping has been exaggerated by the exaggerated motion of the sonar. In practice this
amount is somewhat less than that shown, but the
effect is nevertheless appreciable. Also, in practice, more than two overlapping pings are used,
and the probability of echoes is increased further.
A moving target has a different effect than a
moving sonar. Suppose that a moving target is
detected at a certain point, P, at a time, to, and
that at a later time, t, it is necessary to estimate
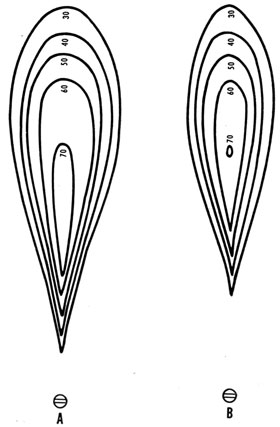
Figure 5-4.-Detection probability of a moving target and a
stationary sonar. A, Change brought about in figure 5-1
after an interval of time; B, change in figure 5-1 after twice
the interval.
105
Figure 5-5. -Probability contours for three successive pings,
allowing for the motion of both target and echo-ranging
vessel.
its position. In order to illustrate the principles
involved, suppose that between to and t no further
pings are sent out and that the direction and speed
of the target are unknown. Then it is possible to
draw probability contours, showing the probability
of the locations of the target at given points at
time t. These contours are circles with centers
at point P. The radii of the contours depend on
the probability that the target moves with the
given speed. As the time interval, t minus to,
increases, these radii also increase because the
unknown motion of the target has more time in
which to take effect.
These same considerations can be applied to the
time interval between pings. If the ping is sent
out at time to, figure 5-1 shows the probability
that, if the target is at a given place, it will detected. At a later time, t, but before the next
ping, the target may have moved. Consequently,
figure 5-1 does not show the probability that, if
the target is at a given place at this later time,
it would have been detected at the earlier time to.
But it is possible in principle to work out the contours for this "prior-detection" probability. The
unknown motion of the target causes the contours
of high probability to shrink as t increases. This
effect is shown schematically in figure 5-4, A and
B, for two successive values of t.
If several successive pings are sent out, shrunken
prior-detection contours must be combined, as
explained with figure 5-3. The result of such a
succession of pings is shown schematically in
figure 5-5. This figure represents the state of
affairs at the time the echoes from the third ping
are being received, and the contours show the
probability that, if the target is then at a given
point, it will be detected then or will have been
detected earlier.
The motion of the sonar and target is exaggerated in figure 5-5 to emphasize important
points. Note that, because of the unknown motion of the target, the 80-percent contour in figure
5-5 has a much smaller area than the 80-percent
contour in figure 5-3. This condition exists even
though the contour in figure 5-3 is based on three
pings and that in figure 5-5 on only two.
Target Bearing
The foregoing considerations of the probability
of establishing sonar contact have been restricted
to simple conditions. In general, the possibility
of taking action against a target in a given area
depends on (1) how completely the area can be
searched in a short time and (2) the ability of the
operator to maintain sonar con tact with the target
once he has contacted it. The first of these
requirements makes it desirable to design the
sonar so that the search area of the ping is large.
The second requirement conflicts with the first.
Special devices have been designed to satisfy
these conflicting requirements. These devices
will be discussed after a preliminary examination
of the operational problem in terms of the simplest
sonar.
MAINTAINING CONTACT
After a signal has been transmitted, the sonar
operator is on the alert for a sound contact with
the target-either as he listens to the sound from
106
the loudspeaker or as he watches the chemical
range recorder. For example he might detect a
break in the background reverberation or noise.
Having made a contact, he is concerned chiefly
With maintaining it. Maintaining contact is difficult with ordinary sonar gear. The target may
move out of the sound beam, either to the right
or to the left. Because of the relatively long
interval between echoes, the uncertainty as to the
direction in which the beam should be rotated is a
serious shortcoming in sonar design.
BEARING DEVIATION
The target bearing is the direction of the line
joining the transducer to the center of the target
and is not necessarily given by the transducer heading, which is the direction of the axis of the sound
beam. Because of the width of the sound beam,
an echo may be received even when the axis does
not bear on the center of the target (for example,
the conning tower in a submarine). Thus, the
target bearing and transducer heading may not
coincide. The difference between them is called
the bearing deviation. When the bearing deviation
becomes greater than a certain amount, the echoes
become too weak to be heard.
As the sonar operator has control of the transducer, he knows its heading. The conning officer,
however, wishes to know the target bearing. If
the bearing deviation is small, it can be ignored.
Unfortunately, every attempt to reduce it increases
(1) the probability that the target may move out
of the sound beam and (2) the seriousness of the
uncertainty mentioned above. Thus, every solution must be a compromise between conflicting
requirements.
It is not only the beam pattern of the transducer
and the target width that affect the possible
magnitude of the bearing deviation; the echo level
and the level of the background noise and reverberation are also instrumental. If reverberation
is limiting, the possible deviation also depends on
the Doppler shift of the echo.
CROSSING THE TARGET
The first solution of maintaining contact and
determining bearing was the operation known as
crossing the target. In this operation, the transducer heading is systematically changed more
rapidly than the target bearing changes. When
the sound beam is trained off the target, the motion of the transducer is reversed and is continued
until the sound beam leaves the target on the
other side. This method tends to eliminate bearing uncertainty. Whenever no echo is obtained
the operator knows on which side of the beam he
will find the target. The two limiting transducer
headings thus obtained are called cut-ons. The
average of two successive cut-ons is taken as the
best approximation to the target bearing.
Although the procedure is practicable, it has
many disadvantages. It is time-consuming, for
it requires at least four, and often more, pings to
obtain one value of the target bearing; hence, before this value is known to the sonar operator, the
target may have moved, rendering the information
more or less obsolete.
SPLIT TRANSDUCERS
Present solutions of maintaining contact and
determining bearing all involve the use of a transducer that has been split into two or more segments. The first application of the split transducer was with searchlight equipment. The two
hydrophones were constructed in semicircular
shape and of such dimensions that they could be
mounted in the same space as the older circular
transducers. Moreover, if electric connections are
changed before transmission, the projected sound
beam can be made identical with that of the older
circular transducer.
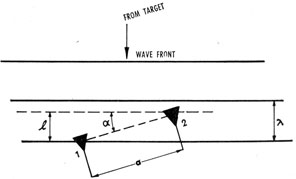
The physical principles involved can most easily
be explained by considering a pair of identical
hydrophones, mounted a distance a apart, with
Figure 5-6. -Three successive stages in the passage of a plane
wavefront from the target to a transducer having two hydrophones (marked "1" and "2") spaced a distance a apart.
107
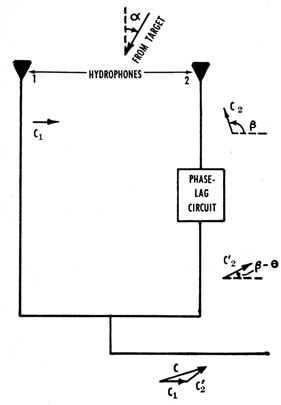
Figure 5-7. -Diagram containing phase-lag circuit, showing
how a desired phase difference between the currents from the
two hydrophones is obtained.
their acoustic axes parallel to each other and perpendicular to the line joining the two hydrophones.
The general arrangement is shown schematically
in figures 5-6 and 5-7. It is assumed that the
pattern of the two hydrophones consists of a
single broad lobe, as shown by the dotted line of
figure 5-9.
Suppose an echo or other single-frequency sound
is incident on the hydrophones from a direction
that makes the angle α with the acoustic axes.
Each wave then reaches the hydrophone closest
to the target before it reaches the other hydrophone, and the alternating currents generated by
them are not in phase. Under the circumstances
shown in figure 5-6, the current from No. 2 is in
advance of that from No. 1. This condition is
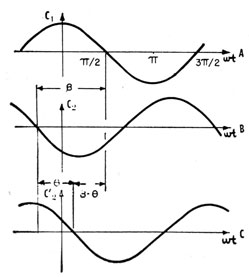
shown in curves A and B of figure 5-8. The
phase angle β can be calculated as follows: After
reaching hydrophone No. 2, the wave must travel
a distance, l, before reaching No. 1. This distance
is
l=a sin α, (5-6)
which is l/λ wavelengths. Because 1 wavelength is
equivalent to a phase change of 360°, the angle β
is
β=360° (a/λ) sin α. (5-7)
If the current generated by No. 1 is
C1=C(α) cos ωt, (5-8)
then that generated by No. 2 is
C2=C(α) cos(ωt+β). (5-9)
The function C(α) is determined by the directivity
pattern of the separate hydrophones-shown by
the dotted curve in figure 5-9. The graphs of the
two currents, C1 and C2, are shown in curves A
and B of figure 5-8.
If the current from hydrophone No. 2 is passed
through a phase-shifting network, the phase shift
β can be altered by any desired amount-say θ.
Figure 5-8. -Currents C1, C2, and C2', of figure 5-7, plotted
against the phase angle ωt, and showing the phase difference
β and β-θ of figure 5-7.
108
The result is the current
C2'=C(α) cos (ωt+β-θ), (5-10)
which is shown graphically in curve C of figure
5-8. The vector diagrams of the circuit shown
in figure 5-7 indicate the relation of the three currents. If C1 and C2' are combined, the resulting
current1 is
C=C1+C2'=C(α)[cos(ωt)+cos(ωt+β-θ)] (5-11)
C1+C2'=2C(α) cos½(β-θ) cos[ωt+½(β-ω)] (5-12)
Figure 5-9. -Graph of equation (5-13) for a/λ=4, and for
θ=90°.
The level of the electrical output is thus
L=20 log [2C(α)] +20 log cos [½(β-θ)]. (5-13)
The first term of this expression is essentially the
directivity pattern of the individual hydrophones.
The second term also depends on the direction
from which sound comes, because β depends on α.
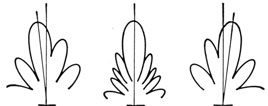
The graph of the resultant level, L, for the case
in which is a/λ is 4 and θ is 90°, is shown by the solid
line of figure 5-9. As a result of connecting the
two hydrophones together, the single broad lobe of
each obviously has been changed into several
narrower lobes.
1 In deriving the equation for C, the following trigonometric relation has been used:
cos A+cos B=2 cos ½ (A+B) cos ½ (A-B).
239276°-53-8
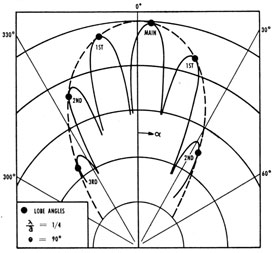
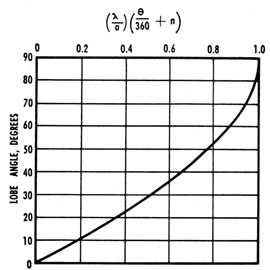
Figure 5-10. -Values of the lobe angles, shown in figure 5-9,
as a function of λ/a and n, the order of the lobe.
As a result of the phase-shifting network, the
axis of the new main lobe does not coincide with
that of the original lobe, and the side lobes are not
symmetrically located. Figure 5-10 can be used
to determine the positions of the lobes for any
value of the quantities θ, λ/a, and the order of the
lobe, n.
In this graph (figure 5-10) the lobe angle is the
point at which the new and original beam patterns
are tangent (figure 5-9), and the integer n is zero
for the main lobe, ±1 for the first lobes on each
side, ±2 for the pair of second lobes, and so
forth. The phase lag, θ, is measured in degrees.
Figure 5-11. -Shift of main lobe of beam pattern in the BDI
system.
109
Bearing-Deviation Indication
All bearing-deviation indicating (BDI) devices
use split transducers. The purpose of BDI devices is to translate into a polarized-magnitude
difference the small echo-signal phase difference
between the two halves of the transducer.
For transmission the two semicircular parts are
connected so as to produce the normal beam of a
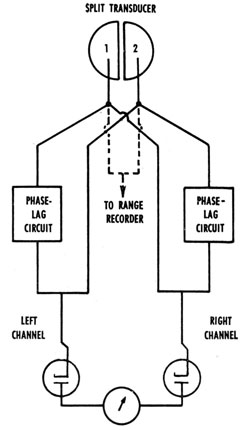
Figure 5-12. -Diagram of the BDI system.
circular diaphragm, which is illustrated by the
center pattern of figure 5-11. The center pattern
shows the normal beam of a circular diaphragm.
The two side patterns show the beams for the two
halves of the circuit. For reception, the two
halves are connected as shown in figure 5-12.
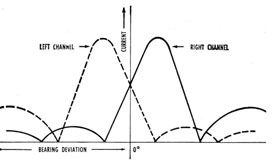
Note that there are two symmetrical output
channels. The connections of the right channel
are the same as those for the pair of hydrophones
Figure 5-13. -Graph of currents from the two channels as a
function of bearing deviation.
in figure 5-7. The connections of the left channel
differ only in that the phase lag also is introduced
into the output of No. 1. The beam pattern for
the right channel thus has its main lobe deflected
to the right, as shown by the right-hand curve of
figure 5-11; the main lobe of the left channel is
deflected to the left. These deflections are shown
more clearly in the rectangular-coordinate system
used in figure 5-13. The ordinates are the currents out of the two channels. In practice these
currents are rectified, as indicated in figure 5-13;
the diode rectifiers are shown in figure 5-12.
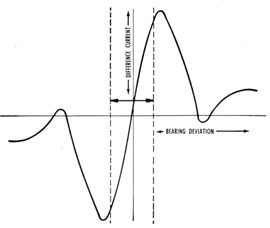
The rectified output currents may be used for
various purposes. They are commonly connected
to an indicator, which may be a cathode-ray oscilloscope, in such a way that the deflection of the
Figure 5-14. -Graph of the difference between the currents
from the two channels as a function of bearing deviation.
110
indicator is proportional to the difference between
the currents in the two channels. This difference
is plotted as a function of bearing deviation in
figure 5-14. Note that if the bearing deviation
is not too great, the difference current is proportional to it. Confusion can occur if the deviation
is greater than the limits set by the double arrow
of figure 5-14.
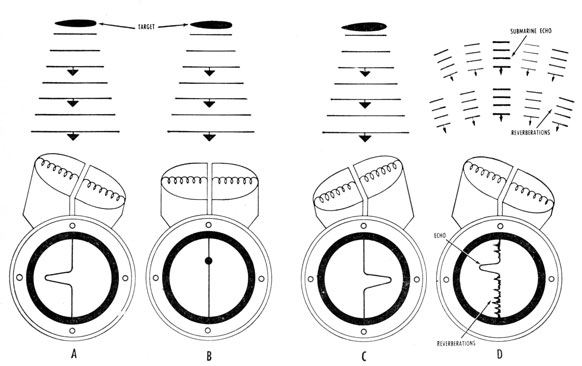
Standard Bearing-Deviation Indicator
The standard BDI provides a visual indication
of the sound incident on the transducer. When
the transducer is trained on the exact center of the
source (figure 5-15, B), the incident sound strikes
both halves of the diaphragm simultaneously.
This condition is indicated by a brightening of the
luminous trace on the screen of the cathode-ray
tube.
When the transducer is trained slightly off the
center of the target (figure 5-15, A and C), the
incident sound waves strike one of the transducer
halves before the other. This action causes the
brightened spot on the screen to be deflected in
the direction of the half on which the sound first
impinges. A deflection to the left thus would
show (1) that the source is to the left of the transducer bearing and (2) that the operator must
train left to get a center bearing. Conversely, a
deflection of the brightened spot to the right would
indicate that the operator must train right. A
strong signal can produce a right and a left deflection of equal magnitude, thus indicating a
center bearing.
Because the BDI reacts to all sound energy
incident on the transducer, it must be used in
conjunction with a loudspeaker in order to distinguish between echoes and reverberations (figure
5-15, D), and between echoes themselves-particularly between the echo from a submarine and
that from its wake. For this purpose the visual
perception is supplemented by listening to a
loudspeaker.
Figure 5-15. -Diagrams illustrating BDI. A, Deflection of the trace to the left by a target on the left of the transducer heading;
B, transducer heading on the center bearing, causing the trace to brighten; C, deflection of the trace to the right by a target on
the right of the transducer heading; D, echo distinguished from reverberations.
111
Scanning Sonar
The problem of rapidly searching a wide area
led to the development of scanning sonars. The
principle employed is to use the necessary interval
between pings to search the widest possible area.
In this way the area searched per ping and the
amount of information received per unit of time
are both increased. Two main types of scanning
sonar have been designed-one transmits short
pulses of sound, and the other transmits a continuous signal of varying frequency.
PULSE-TYPE SCANNING SONAR
Pulse-type scanning sonar equipment is, in
effect, a combination of two types of ultrasonic
echo-ranging and listening equipments operating
simultaneously. One provides a continuous visual display of acoustic reception from all directions, and the other provides audio response from
any desired single direction. The single-direction
type is the exact equivalent of "searchlight" sonar.
The function of detection by echo ranging is accomplished by transmitting a pulse of sound power
in all directions and then scanning in azimuth for
all echoes, which are made to appear as bright
spots on a cathode-ray tube screen at the correct
bearing and at a distance from the tube center
proportional to the range. A more detailed investigation of a particular echo is obtained by
training the audio system to the bearing indicated.
The resulting audio output assists in identifying
echoes, as well as in providing the signal for accurate range determinations. The reception of
signals from noise sources, which is possible without transmission, produces a continuous radial
pattern on the cathode-ray tube screen at the
proper bearing, and the audio character of this
noise may be ascertained by training the audio
system along that line or bearing.
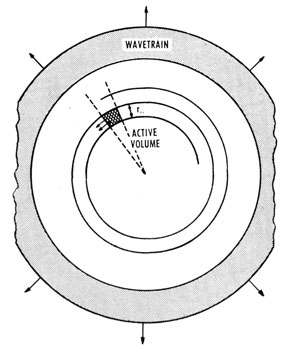
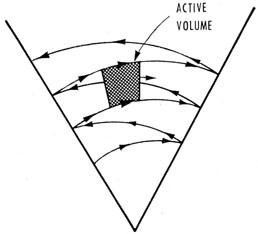
At any instant the outgoing train of waves
occupies a ring-shaped region (figure 5-16) marked
"wave train." The radius of this region increases
with time. Echoes can be returned to the transducer at a given instant from only a small region-the "active volume" shown as cross hatching in
figure 5-16-which is determined by the ping
length, ro, and the angular width of the beam.
This region is located at half the range of the
wave train and has half the extent of the
wave train; its width, or extent in bearing, is
limited by the directivity of the transducer on
reception. Because the receiving beam pattern
of the transducer is rotating, the active volume
describes a spiral path. The radius of the spiral
increases with half the velocity of sound; the speed
of the active volume in the spiral path is much
greater than this velocity.
In order for the active volume to encounter
every possible target at some time, the beam
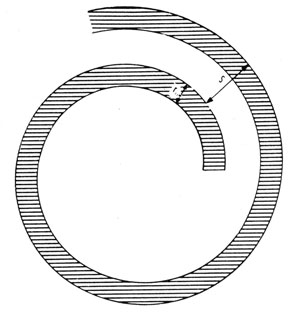
pattern must not be rotated too slowly. Otherwise, the condition illustrated in figure 5-17
results; there is a dead area between the rings of
the spiral traced out by the active volume. This
dead area is shown unshaded, and echoes from
targets in it are not received. In this case, the
distance, S, of the spiral is greater than the ping
length, ro. If the beam pattern makes one revolution during the ping duration to of the signal, S
equals ro, and there will be no dead areas. If to is
expressed in milliseconds and ro in yards, ro equals
Wave train and active region for a rotating receiving beam pattern.
112
Figure 5-17. -Result of rotating a beam pattern too slowly.
0.8to, because to equals 2ro/v seconds, where v is the velocity of sound.
Conversely, if the rotation of the beam pattern
is fixed, the ping must have a duration of at least
one revolution. Thus, if the beam pattern is
rotated at 1,800 rpm, one revolution takes place
in 33.3 milliseconds, and consequently the ping
length must be greater than 0.8 times 33.3, or
26.7 yards. A value of 30 yards for ro is safe if the
active area is truly rectangular.
A consequence of the rotation of the beam pattern is that the echo will not have the same duration as the transmitted pulse. The echo will be
received only while the beam pattern is passing the
target. If the effective width of the beam pattern
is θ degrees, the echo from a point target-that
is, a target smaller than the active area-will be
received during θ/360 of a revolution. For example,
if θ equals 11° and the speed of rotation is 1,800
rpm, the duration of the echo is approximately 1
millisecond. Expressed in yards, the echo length,
r1, is 0.8 yard. The echo length, r1, must be
distinguished from the ping length, ro. In every
case, r1 is smaller than ro and is independent of the
ping length, provided the ping length is of the
required order of magnitude.
The shortness of the echo duration is a consequence of the increased velocity with which the
active volume moves. This increased velocity of
the active region is the primary characteristic of
pulsed scanning sonar.
The short duration of the echo, in its turn, has
the following consequences:
1. Doppler discrimination is much impaired.
2. Because the spectrum of the short echo
extends over many critical bandwidths of the
ear, the advantage of the ear over other
methods of perception is lost.
3. The pass band of the receiver must be at
least wide enough to pass the short echo.
This width involves increased noise levels.
4. The level of the reverberation, being determined by the volume of the active region, Is
comparable to that of a standard sonar that
transmits a ping of length ro and is thus
greater than for a ping of length r1.
5. The coherence of the reverberation is comparable to that of sonars transmitting pings
of length r1.
These five effects tend to reduce the maximum
range obtainable on a given target unless compensated either by a suitable device for detecting
the echo or by the following effect.
6. The target strength of an extended object is
determined by the size of the active volume
and is therefore that which is characteristic
of standard sonars transmitting pings of
length ro.
PLAN-POSITION INDICATORS
The high rate of rotation of the beam pattern
makes it impossible for an operator to follow the
changes in its heading with his unaided senses.
This factor and effects 1 and 2 of the preceding list,
make it necessary to use special devices to portray
the echo and render the bearing and range of the
target perceptible. These devices are called plan-position indicators (PPI).
The only device of this kind that is feasible for
the high rates of rotation involved is a persistent-screen cathode-ray tube. The spot of this scope
is made to describe a spiral path in synchronism
with the active area. The path of the spot on the
113
screen is thus a map of the path of the active area.
The brightness of the spot is controlled by the
intensity of the received sound, so that an echo is
seen as a brighter spot than the background of
reverberation and noise. Because of the synchronization of the spot with the active area, the echo
appears at the proper range and relative bearing
on the screen.
If there are several targets in the field, they will
be portrayed in their proper relative positions.
Echoes obtained from reefs or sand banks appear
on the screen as brightened areas. Thus a scanning sonar with a PPI presents the operator with a
complete map of the underwater situation.
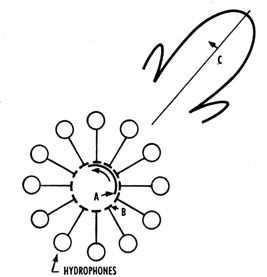
ROTATING-TYPE SCANNING SONAR
In theory, the transducer of a scanning sonar
Could be directional and rotated about a vertical
axis. However, the bulk of the transducer and
the high rotational speeds required make this design impracticable.
Similar results can be accomplished by using a
ring of stationary transducer units and connecting
them in succession by means of a commutator
(figure 5-18). In figure 5-18, however, only 12
transducer units are shown, whereas in practice
48 are used. Each of these is connected to one
segment, B, of a stationary commutator. These
Figure 5-19. -Principle of scanning a sector rather than the
complete horizon.
segments are contacted by a rotating brush, A,
which connects five or six transducer units to the
receiver at any one time. As the brush rotates,
these units are disconnected in succession and replaced by others farther along the ring. The result
is that the receiving beam pattern of the array
is markedly directional and rotates with the
brush, A.
Because sliding contacts would generate too
much electrical noise, a small gap is provided between the moving element, A, and the commutator
segments, so that the brush is replaced by one
plate of an electric capacitor. The received signal
is thus connected to the receiver input by capacitive coupling rather than by conduction. This
coupling, however, does not entirely eliminate commutator noise.
A second proposal for avoiding electric noise involves the elimination of all moving parts, and the
use of electronic switches to perform the commutation.
In chapter 6 a typical scanning system is discussed in detail.
Sector-Scan Indicators
The echo length resulting from the necessarily
rapid motion of the active volume can be increased
somewhat by scanning only a sector rather than
the complete horizon. In this case the path of the
active volume must be somewhat as shown in the
schematic diagram in figure 5-19, and its speed
can be reduced.
114
The oscillation of the receiving beam pattern
can be accomplished by a modification of the principles already discussed in connection with the
BDI.
F-M SCANNING SONAR
The long delay between the transmission of the
signal and the reception of the echo, which is
caused by the low velocity of sound, is a handicap
in search operations. A pulsed scanning sonar
utilizes this delay to scan all bearings, thus effectively increasing the speed of the active area.
The delay period also can be used to make other
than single-frequency transmissions. Obviously,
if the delay period is so used, a given echo must be
associated with a given transmission. The idea
can be illustrated very simply, as follows:
If the maximum practical range is about 3,000
yards, the maximum time delay is about 4 seconds.
Suppose (1) that during these 4 seconds 8 pulses are
transmitted at ½-second intervals, and (2) that the
frequency of each pulse differs from that of its
predecessor by a stated amount. The frequencies
of the pulses may form the tones of the major diatonic scale; if so, a musically inclined listener, on
hearing an echo, can recognize its pitch and thus
identify the ping responsible for it-provided, of
course, that both source and target are stationary.
Otherwise, doppler effect will alter the pitch of the
echo. Some means has to be provided for recording
the time and the transducer heading for each
ping so that the range and bearing of the target
can be determined.
Although this illustration is greatly oversimplified, it serves to introduce the discussion of a sonar
that uses the f-m principle.
In practice it is simpler to change the frequency
gradually rather than by abrupt steps. The
frequency is decreased at a constant rate for some
seconds; then, when it approaches the lower limit
of the pass band of the receiver, it suddenly is
increased to its original value, and the constant
rate of decrease begins again. The principle is
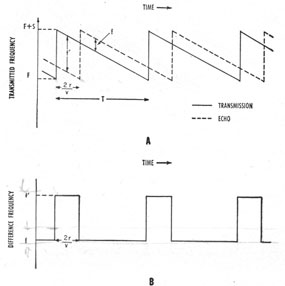
explained by the time graph of the transmitted
frequency shown in figure 5-20, A. The transmitted sound frequency is a sawtooth signal.
The intensity of the transmitted sound is kept
constant during the transmission.
A target located in the sound beam returns a
continuous echo and, if both the sonar and the
target are stationary, this echo reproduces the
constant frequency change of the transmitted
signal. In figure 5-20, A, the solid curve is the
frequency-time graph of the sawtooth signal;
the dotted curve, that of the echo. Because of
the time delay between transmission and echo,
the sawtooth graph of the echo lags behind that
of the signal by 2r/v second. The time interval
indicated by T in figure 5-20, A, is the sawtooth
interval. During a portion of the sawtooth
interval, the echo frequency is less than the
transmission frequency by a difference f'. During
the remainder of the sawtooth interval the echo
frequency is greater than the transmission frequency by a difference, f. This difference is
illustrated by figure 5-20, B, in which the difference in frequencies between signal and echo is
plotted as a function of time. The frequency
difference, f, remains constant for relatively long
periods and then jumps suddenly to the value, f'.
The frequencies are subtracted electrically by
applying the heterodyne principle-a voltage
tapped from the transmitter is combined with the
echo signal in a heterodyne stage of the receiver.
The range is determined from either of the
Figure 5-20. -Principle of f-m sonar. A, Transmitted frequency and the echo frequency as a function of time; B,
frequency difference as a function of time.
115
frequency differences f or f'; the calculation of range
from frequency difference is given later in this
discussion.
Up to this point it has been assumed that there
is only one target in the sound beam. If there is
more than one returning echo, each echo will have
its time graph of frequency, the displacement of
which, relative to the graph of the signal, depends
on the range of the target. The output of the
receiver thus contains components of several frequencies-one pair of frequencies for each target
in the sound field. This complex output must be
analyzed into its components in order to determine the range of the several targets.
The active volume from which echoes are being
received occupies the whole sound field. Furthermore, with omnidirectional projectors and hydrophones, no scanning of the field is possible. Thus,
the basic principle of continuous transmission
sonar in achieving effective detection is to employ
a maximum size of the active volume, rather than
to increase the speed of a small active volume as
is done in pulsed-scanning sonar. The method
just outlined for accomplishing this effective
detection is called f-m sonar.
When used with a stationary projector and
hydrophone, f-m sonar is not a bearing-scanning
device. If it is used with an omnidirectional
projector and a rotating receiving hydrophone,
however, it becomes a scanning sonar with
reduced active volume, but is different from the
pulsed type.
Parameters of F-M Sonar
Relation between target range and echo frequency.-How the frequency difference between the echo
and the transmitted signal determines the range
is apparent from the following discussion and from
figure 5-20.
The duration of one sawtooth waveform is T
seconds. During this interval the frequency
varies at a constant rate from F+s to F; where s
is called the sweep of the frequency. In one
model, the QLA, F is 36 kc and s is 12 kc. T is
usually from 1 second to 12 seconds.
The following relations exist between the
several parameters:
1. The constant rate of frequency decrease is s/T
kilocycles per second.
2. The delay time for an echo from range, r,
is 2r/v seconds.
3. In by 2r/v seconds the frequency therefore decreases
by (2r/v)(s/T) kc and the frequency difference, f, shown
in figure 5-20, A, is
f= 2r/vs/T kc. (5-14)
4. From equation (5-14), the range, r, is
r= vTf/2s. (5-15)
5. The frequency difference, f, is maintained for
T- 2r/v seconds. At the end of this interval the
transmitted signal has reached the bottom of the
frequency sweep and returns to the top of the
sweep. During a succeeding time interval equal
to 2r/v seconds, the echo frequency is less than the
transmitted signal frequency by f' kc (figure
5-20), where
f'=s-f. (5-16)
If the sawtooth interval, T, is several times greater
than the delay time of echoes from the maximum
range, frequency f is less than s/2 and frequency f'
is greater than s/2.
6. The duration of frequency f' is considerably
less than the duration of frequency f. Consequently, it is economical to ignore frequency
f' and concentrate on the determination of frequency f.
Determination of frequency difference and range.-From equation (5-15) it is evident that f must be
known to determine r. The range, r, is determined as follows:
Suppose the heterodyned output (the hydrophone output mixed with a sample of the signal) is
passed through a band-pass filter that is centered
at f kc, and that has a width w kc. This filter
then passes an echo if its frequency lies within the
band between f-w/2 and f+w/2. Thus the sound
energy admitted by this filter comes from a certain active area (figure 5-21), which is a sector
of a circular ring.
116
A battery of such filters can be used to establish
a series of channels, each of which is constantly
alert to echoes from a certain active area. The
dimensions of the area corresponding to a given
filter can be calculated easily. The greatest
range from which the particular filter under consideration will accept an echo is, from equation (5-15),
rmax=vT (f+½w)/2s,
and the smallest range is
rmin=vT (f-½w)/2s,
The radial extent, ro, of the area is the difference
between the two ranges, and thus
ro=vTw/2s. (5-17)
The other dimension of the active area can be
determined by the range and the width of the
receiving beam pattern; and from elementary
geometry, its mean value is the product of the
mean range and the angular width of the beam
expressed in radians.
The dimensions of the active area are proportional to the sawtooth interval T and, in so far
as they are determined by T, are under the operator's control. For example, if T equals 12
Figure 5-21. -Active areas associated with the individual
channels in f-m sonar.
seconds, s equals 12 kc, and w equals 35 cycles per
second, then ro equals 27.6 yards. Reducing the
value T to 1 second would make ro equal 2.3
yards, if v is taken equal to 4,742 feet per second.
As has been remarked, each of the channels is
almost constantly alert to targets in the particular
area associated with it. These areas are indicated
in figure 5-21. As the active area of each channel
is stationary, the whole sound field (figure 5-21)
can be covered by making the areas of adjacent
channels overlap slightly.
Because of the exclusion of frequency f', each
channel normally is inert for a fraction of each
sawtooth cycle. However, this fraction can be
made as small as desired or even can be eliminated
by means of a recent ingenious development.
The fact that the active areas are stationary
may give the impression that the range cannot be
determined as precisely as with pinging sonars.
However, the precision is the same as for a ping
length equal to ro. The quantity ro defined by
equation (5-17) can be called the effective ping
length of f-m sonar.
Range and bearing indication.-The range is
read on an oscilloscope with a persistent screen.
The filters corresponding to the various mean
ranges of the several channels are arranged so
that their output brightens the trace of the
cathode-ray tube at a point where the scalar
distance from the center of the tube is proportional to frequency f and thus to the range. The
bearing of the echo spot on the oscilloscope corresponds to the hydrophone heading.
Echo duration.-The duration of the echo depends on whether the hydrophone is stationary or
is being rotated. If the projector is nondirectional, the echo received by a stationary hydrophone has a duration nearly equal to the sawtooth
period, T. If the hydrophone is rotated, the echo
duration is reduced and may become equal to the
time required for the hydrophone beam to sweep
across the target. The rate of rotation can be
made as small as required to obtain an echo of any
desired duration less than T. In this respect f-m
sonar differs from the pulsed scanning sonars
described previously.
The rate of rotation, however, cannot be increased beyond a certain critical value. This
limitation is imposed by the use of filters, which
require a finite time interval to respond fully to the
117
echo. The minimum time interval depends on the
band-pass width, w, of the filter and must be
greater than 1/N second, if w is in cycles per second.
In other words, if the beam pattern of the hydrophone rests on a point target less than the time
required for 1 cycle at the band-pass frequency, the
echo will not be detected.
Suppose that the hydrophone is rotated at a rate
of N rpm and that its beam width is θ°. A complete
revolution requires 1/N minutes, which equals 60/N
seconds. The beam occupies θ/260 of a revolution;
thus the time required for it to sweep across a
given point θ/360 times 60/N, or θ/6N seconds. Hence,
it is necessary that
θ/6N > 1/w,
from which it follows that N must be less than
θw/6.
For example, let θ equal 11° and w equal 35
cycles per second; then N must be less than 65
rpm. The echo duration for 65 rpm is 29 milliseconds; the corresponding echo length is 23 yards.
If the rotation is slower the echo length increases.
Doppler range error.-It is clear that, because
f-m sonar uses the frequency of the echo to determine the range of the target, the Doppler shift
resulting from a possible relative motion of sonar
and target introduces an error into the indicated
range. The magnitude of this error must be evaluated.
F-m sonar is calibrated to give the indicated
range, ri, according to equation (5-15)-
ri= vTf/2s.
This equation gives the correct range if the target
is not moving, but it is necessary to calculate the
error in ri caused by the Doppler change of frequency when the range is opening or closing.
In all echo-ranging operations three instants of
time must be considered. These instants are (1)
t1, the time at which the primary sound was transmitted from the transducer; (2) tT, the time at
which the echo was reflected from the target; and
(3) tE, the time at which the echo was received.
If there is any relative motion of sonar and
target, the range is different at these three times.
Call the corresponding ranges r1, rT, and rE. In
pulsed sonar the range indicated is always rT
regardless of the possible motion of sonar and
target. The differences between r1, rT, and rE
are negligible. This fact can be verified quickly
if it is remembered that a speed of 1 knot is equivalent to 0.56 yard per second, so that a speed of
25 knots involves an error of less than 50 yards in
a range of about 3,000 yards.
None of the three ranges just defined is the range
indicated by f-m sonar. Range ri is defined by
equation (5-15). In order to calculate ri the
following three ultrasonic frequencies must be
distinguished:
1. F1, the frequency that was being transmitted
at time t1.
2. FE, the frequency that was being transmitted
at time tE.
3. F'E, the frequency of the echo that was being
received at time tE.
The quantity, f, of equation (5-15) is obviously
F'E-FE hence,
ri=vT/2s(F'E-FE). (5-18)
The frequencies FE and F'E must be examined
more closely. To simplify the calculations, the
sonar is assumed to be stationary. No error is
introduced by this assumption if dR of equation
(5-20) is interpreted as the range rate. When the
target reflects the sound its range is rT, and the
transmitted frequency, by the time tE, has been
reduced by (2rT/v)(s/T): The possible motion of
the target will not affect this quantity. Thus, the
frequency being transmitted at the instant when
the echo is received is
FE=F1-(2s/vT)rT (5-19)
The frequency of the echo, on the other hand, is
affected by the motion of the target. From the
theory of the Doppler effect, the value F'E is
approximately
F'E=F1±(2dR/v)F1 (5-20)
where dr is the range rate of the target. If equation (5-19) is subtracted from equation (5-20),
F'E-FE=(2s/vT)rT±(2dR/v)F1, (5-21)
118
and if equation (5-21) is substituted into equation
(5-18),
ri=rT±(dRT/s)F1. (5-22)
The error in the indicated range, as shown by the
last term in equation (5-22), is therefore proportional to the velocity of the target and is zero
only for stationary targets.
For example, let T equal 12 seconds; s equal
12 kc, and F, equal 36 to 48 kc; then
TF1/s=36 to 48 seconds.
The range error is thus the distance moved by the
target in 36 to 48 seconds. The larger error occurs
when the sawtooth frequency, F1 is high and the
smaller error occurs when it is low. The distance
traversed in 48 seconds by a submarine at 10
knots is slightly more than 200 yards.
Note that the error is also proportional to the
sawtooth period. Thus, if T had been 1 second
in the example, the range error would be the distance moved by the target in 3 to 4 seconds, or
about 20 yards, at a speed of 10 knots.
This range error is very similar to the range
correction which must be made in determining the
time to fire on a moving target. It has been
proposed to utilize this similarity so that the
indicated range of f-m sonar can be used without
this correction in fire control problems. For this
application, it is essential for the frequency to
increase rather than to decrease during each
sawtooth period.
Location of Small Objects
The echo-ranging equipment in use at the
beginning of World War II was designed for the
detection of relatively large submarines. As the
war progressed it became imperative to design
equipment for the detection of mines and other
small objects. The standard test object in this
development work was a sphere 3 feet in diameter.
The target echo strength of such a sphere is some
20 db lower than that of a large submarine.
Because of this small echo strength, the ranges in
small-object detection generally are comparatively
short and thus are limited by reverberation rather
than by background noise.
In order for an echo to be detected against a
background of reverberation, the total echo
strength of all the scatterers in the active volume
of a ping must be less than the echo strength of
the sphere; otherwise, the reverberation intensity
is greater than that of the echo and masking
prevents detection.
The echo strength of the reverberation can be
decreased by reducing the size of the active volume. There are two ways in which this decrease
can be accomplished: (1) The ping length can be
decreased; and (2) the beam can be made narrower.
The second method is not suitable for shipboard
installations because it involves a decrease in the
effective search area and thus causes great difficulties in maintaining contact with the target.
This situation leaves only the ping length as an
available parameter for reducing the size of the
active volume.
The use of short pings is thus a characteristic
of many sonars designed for small-object detection.
In this phase of echo ranging, the reasons for the
success of scanning sonars-which do not use
short pings-are not clearly understood; however,
their success probably depends on the plan-position
presentation of the echo, or upon the limitation of
the active volume by the scanning process.
RATIO OF ECHO TO REVERBERATION AS A
FUNCTION OF PING LENGTH
According to the theories that have been previously explained, the reverberation intensity is
proportional to the ping length, ro. The echo
level, on the contrary, is independent of ping
length except when the ping length becomes less
than the variation in range for different parts of
the target. If the target is complicated its target
strength is less for short pings. This condition
exists because the echoes from some parts of the
target no longer overlap those from other parts.
However, if the target has a smooth surface, with
no irregularities of dimensions comparable to 1
wavelength of the sound, this reduction in target
strength will probably not occur. The theory of
echo formation has not been worked out sufficiently to cover this point.
119
The results show that the echo-reverberation
ratio increases with decreasing ping length even when the ping length is as small as one-eighth the diameter of the sphere. They also show that this ratio generally decreases with increasing range out to 400 yards, thus supporting the idea that reverberation, rather than background noise, is the limiting factor in this work. Such results are rather surprising because a wide-band receiver is necessary for the use of these very short pings. The qualitative distinction between reverberation
and noise largely disappears at these ping lengths, for both reverberation and noise sound alike to the listener and have a similar appearance on an oscillogram. Consequently, these experiments are the best evidence that reverberation, and not noise. is the masking agent. This high level of reverberation is due to a combination of factors, principally the shallow water and the short range. Both are typical of the conditions under which the equipment must operate.
Variation of Gain
The optimum gain setting is the one which makes the masking background just audible. If the gain is less than the optimum, weak signals will not be heard even though they are stronger than the background. If the gain is much greater than the optimum, there is danger that a signal will overload the amplifier, resulting in (1) distortion and (2) a reduction of the signal-background ratio in the airborne output.
This situation is complicated when reverberation is the masking background, because the reverberation level varies greatly during the period following transmission.
The obvious solution for this problem is to devise a sonar receiver in which the gain continuously increases during the period following transmission of the ping. The receiving circuits for accomplishing this time variation of gain (TVG) are controlled by the discharge of a capacitor that is charged (During the transmission. The rate at which the gain increases can be controlled by altering the resistance of the discharge circuit. The total increase in gain can be adjusted by altering the voltage to which the capacitor is charged.
Although TVG improves the operation of the echo-ranging equipment, it fails to meet all the requirements. One disadvantage of TVG is that the gain is increased in a regular manner. This regular increase of gain would be satisfactory if reverberation decreased in an equally regular manner, but reverberation decrease is not always regular, especially in shallow water. Consequently, the possibility of using the background to control the instantaneous gain was explored.
Circuits that can control the gain automatically
are common in radio receivers. Such circuits are called automatic volume controls (AVC). The use of AVC circuits in sonar receivers, however, has proved to be very disadvantageous. AVC circuits can be adjusted to respond rapidly or slowly to changes in the input. If they respond to the rapid fluctuation of reverberation, they also respond to the change in intensity due to the echo. This response is unavoidable, because the reverberation signals last about as long as those of an echo from a point source. With this adjustment the AVC reduces the gain during the time the echo is being received-an obviously undesirable situation. If, on the other hand, the AVC is adjusted so that it does not reduce the gain during the echo. it becomes so sluggish that it fails to respond to the slower changes in mean reverberation level-for example, to the peak of bottom reverberation.
A compromise solution, called the reverberation-control of gain (RCG), has been developed. RCG is similar to TVG in that the gain constantly increases during the period following transmission. It is similar to AVC in that the momentary level of the receiver input controls its operation. In RCG, however, it is the rate of increase of gain that is controlled and not the gain itself. It is obvious that an RCG circuit cannot reduce the gain at the instant the echo arrives; it merely reduces the rate at which the gain increases while the echo is being received. Thus, it does not have the disadvantage of an AVC circuit.. RCG responds somewhat, to the special characteristics of reverberation at a specific time and place and thus does not have the disadvantage of a TVG circuit that is improperly adjusted for the momentary conditions.
120
Maintenance of Close Contact
The development of deep-diving, high-speed submarines presented a serious problem. The echo-ranging equipments in use at, the beginning of World War II were not capable of maintaining sonar contact on a deep submarine when the range was closed. The deeper the submarine was operating, the greater the "lost-contact" range. Sometimes the contact was lost at 600 yards because the submarine passed under the lower limit of the sound beam. A loss of contact made it impossible to attack successfully, because the high speed of the submarine enabled it to be a considerable distance from the point of lost contact.
This problem can be overcome by mounting the transducer like a searchlight, so that it can be (1) rotated about, a vertical axis and (2) tilted about a horizontal axis. If the axis of a tilting beam
transducer is depressed toward the deep target, and hence away from the surface, the echo level can be increased and the surface reverberation decreased. A sonar equipped with the tilting-beam transducer can also determine the depth of a target, as will be explained later.
Another method, known as maintenance of
close contact (MCC), changes the connections of the transducer elements so that the beam becomes very broad in the vertical plane. This change is accomplished by a switch so that at long ranges the beam pattern is undisturbed because the distortion of the beam reduces its efficiency. This inefficiency is inconsequential at the shorter ranges, where contact would be lost if the MCC feature were not used.
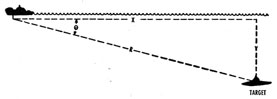
Depth Determination
Both the depth and the horizontal range of the
target can be determined by mounting a transducer so that the beam can be tilted in the vertical plane. The geometry of the situation is shown
in figure 5-22. The range indicator of the sonar
Figure 5-22.-Geometry of depth determination.
equipment shows the slant range, R. The depth
of the target below the projector is Y and its horizontal range is X. If the angle of tilt, θ, is known, the values of X and Y can be calculated from the equations
X=R cos θ
and Y=R sin θ. (5-23)
Various automatic or semiautomatic methods of performing this calculation have been devised.
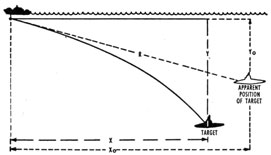
REFRACTION ERROR
Equations (5-23) assume that the sound rays are straight lines, as shown in figure 5-22. If the rays are refracted (figure 5-23), the values
computed from this equation are Xo and Yo instead of
the actual values X and Y. The errors Y-Yo, and X-Xo can be quite large, especially when there is a marked downward refraction.
The errors arise from two causes: (1) The sound
does not travel in a constant direction, and (2) it
does not travel at a constant speed. The determination of the corrections to be applied is similar to a problem in exterior ballistics. The problem can be solved by the same methods, but when there is a marked thermocline the magnitude of the correction required is increased, as is also the accuracy required in making the approximate calculation. Semiautomatic methods have been developed to speed the application of the correction during combat.
Figure 5-23. -Effect of downward refraction on depth determination.
121
Integrated Sonar System
The integrated sonar system is an attack system.
It is composed of several sonar and fire control
equipments operating in a reciprocal information
and control network.
The antisubmarine system used at the outbreak
of World War II consisted of a single echo-ranging
equipment. From the equipment, the bearing
and slant range of the target could be obtained.
The procedure of "crossing the target," previously
explained, established the bearing rate. If this
information was plotted on a maneuvering board
and if a stop watch was used to time the development of the attack, the range rate could be determined, as well as the approximate course and speed
of the submarine. The conning officer guessed
the depth of the submarine from the range at
which sonar contact was lost because of the targets passing under the sound beam.
By the time the lost-contact range was reached,
the ASW vessel was on its attack course and was
proceeding to saturate the area with depth charges.
This method was fairly effective against the old
type of submarine with riveted construction,
because the pressure hull could be ruptured by a
nearby explosion. One disadvantage of delivering a depth-charge attack against a modern submarine is that the pressure hull with its all-welded
heavy-metal construction can withstand anything but a direct hit or a very near miss.
Other disadvantages of delivering a depth-charge attack on a modern submarine are as follows:
1. Because the charges sink very slowly, a large
lead must be taken to place them well ahead
of the target. Thus, contact is lost before
the charges are dropped. The time between lost contact and the point of dropping
the charges, plus the time required for them
to sink to the proper depth, gives the submarine time to evade.
2. After contact is lost on a high-speed target,
it is difficult to regain. When a depth charge
explodes, it sets up a turbulent area that returns strong echoes. The submarine may
escape from the area because echoes from
the turbulent area mask the echoes from the
submarine.
To attack a modern submarine successfully the
following requirements must be met:
1. After contact has been established it must be
maintained until the submarine is put out of
action.
2. Only ahead-thrown weapons that explode on
contact should be used.
3. The depth and horizontal range of the target must be determined as well as its bearing,
speed, and course.
An integrated system has been designed to
meet and to coordinate these requirements. This
system requires two echo-ranging equipments-one equipment for azimuth search, which furnishes
the slant range and bearing, and the other for
depth search, which furnishes the depression angle
of the target. From the slant range and depression angle a sonar resolver computes the depth
and horizontal range. To obtain the most accurate sonar information possible, the equipment
must be stabilized so as to remove the components
of own ship roll and pitch. Such a system requires
a stable element and a stabilization computer.
An underwater battery fire-control system is
used to solve the fire control problems of the
(1) target course and speed, (2) course that own
ship should steer, and (3) time to fire. Included
in the system are plotting devices for keeping
track of the attack as it develops.